Results & Compare
Most backtesting tools are fire-and-forget — you run a test, read the number, and it's gone. StrategyXL saves every run automatically, so your whole testing history is there to filter, revisit, and compare side by side. A session of experiments becomes a decision, not a pile of screenshots.
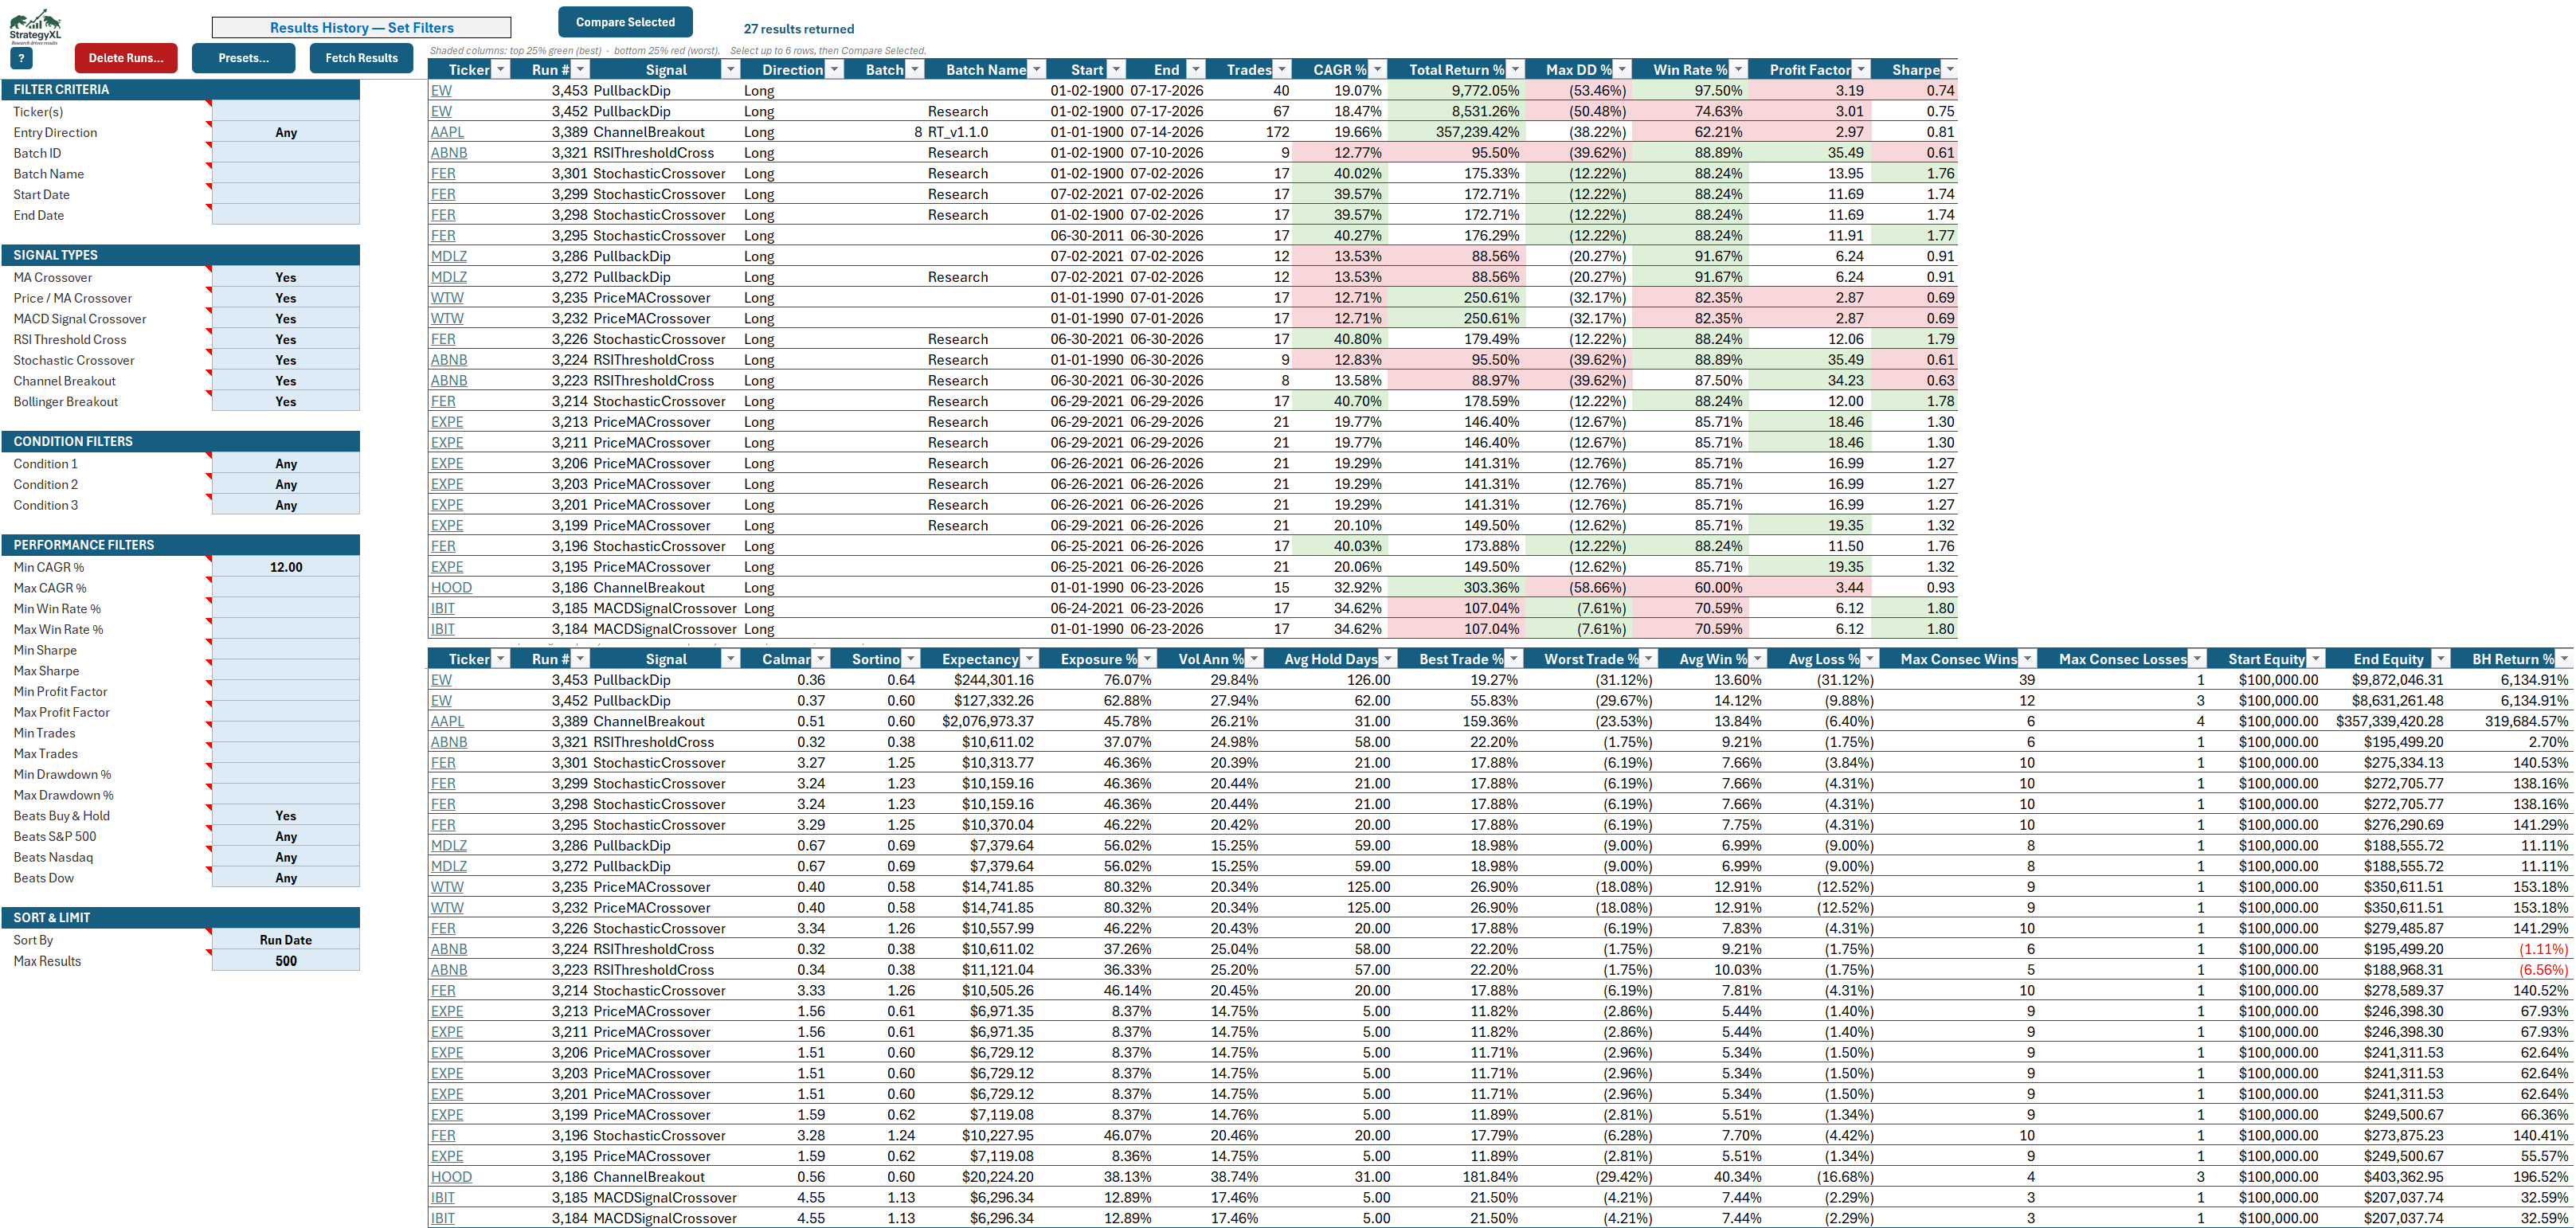
Run a hundred backtests across a hundred tickers and every one is still there tomorrow — queryable, sortable, and comparable. That saved history is where scattered experiments turn into a strategy you can actually defend, and it's the piece most backtesting tools simply don't give you.
A queryable ledger of every run — filter by ticker, signal, date, and performance, save your favorite filter presets, and read the numbers at a glance with a KPI heatmap that bands the best and worst quartiles. Prune what you don't want with a safe soft-delete that always previews the count first.
Synthesis instead of a table: summary stat cards, a return-vs-risk scatter with an efficient-frontier line (drawdown on one axis, CAGR on the other, colored by signal), aggregate KPIs, and leaderboards of the best run per ticker and per signal. Click any point to open that run.
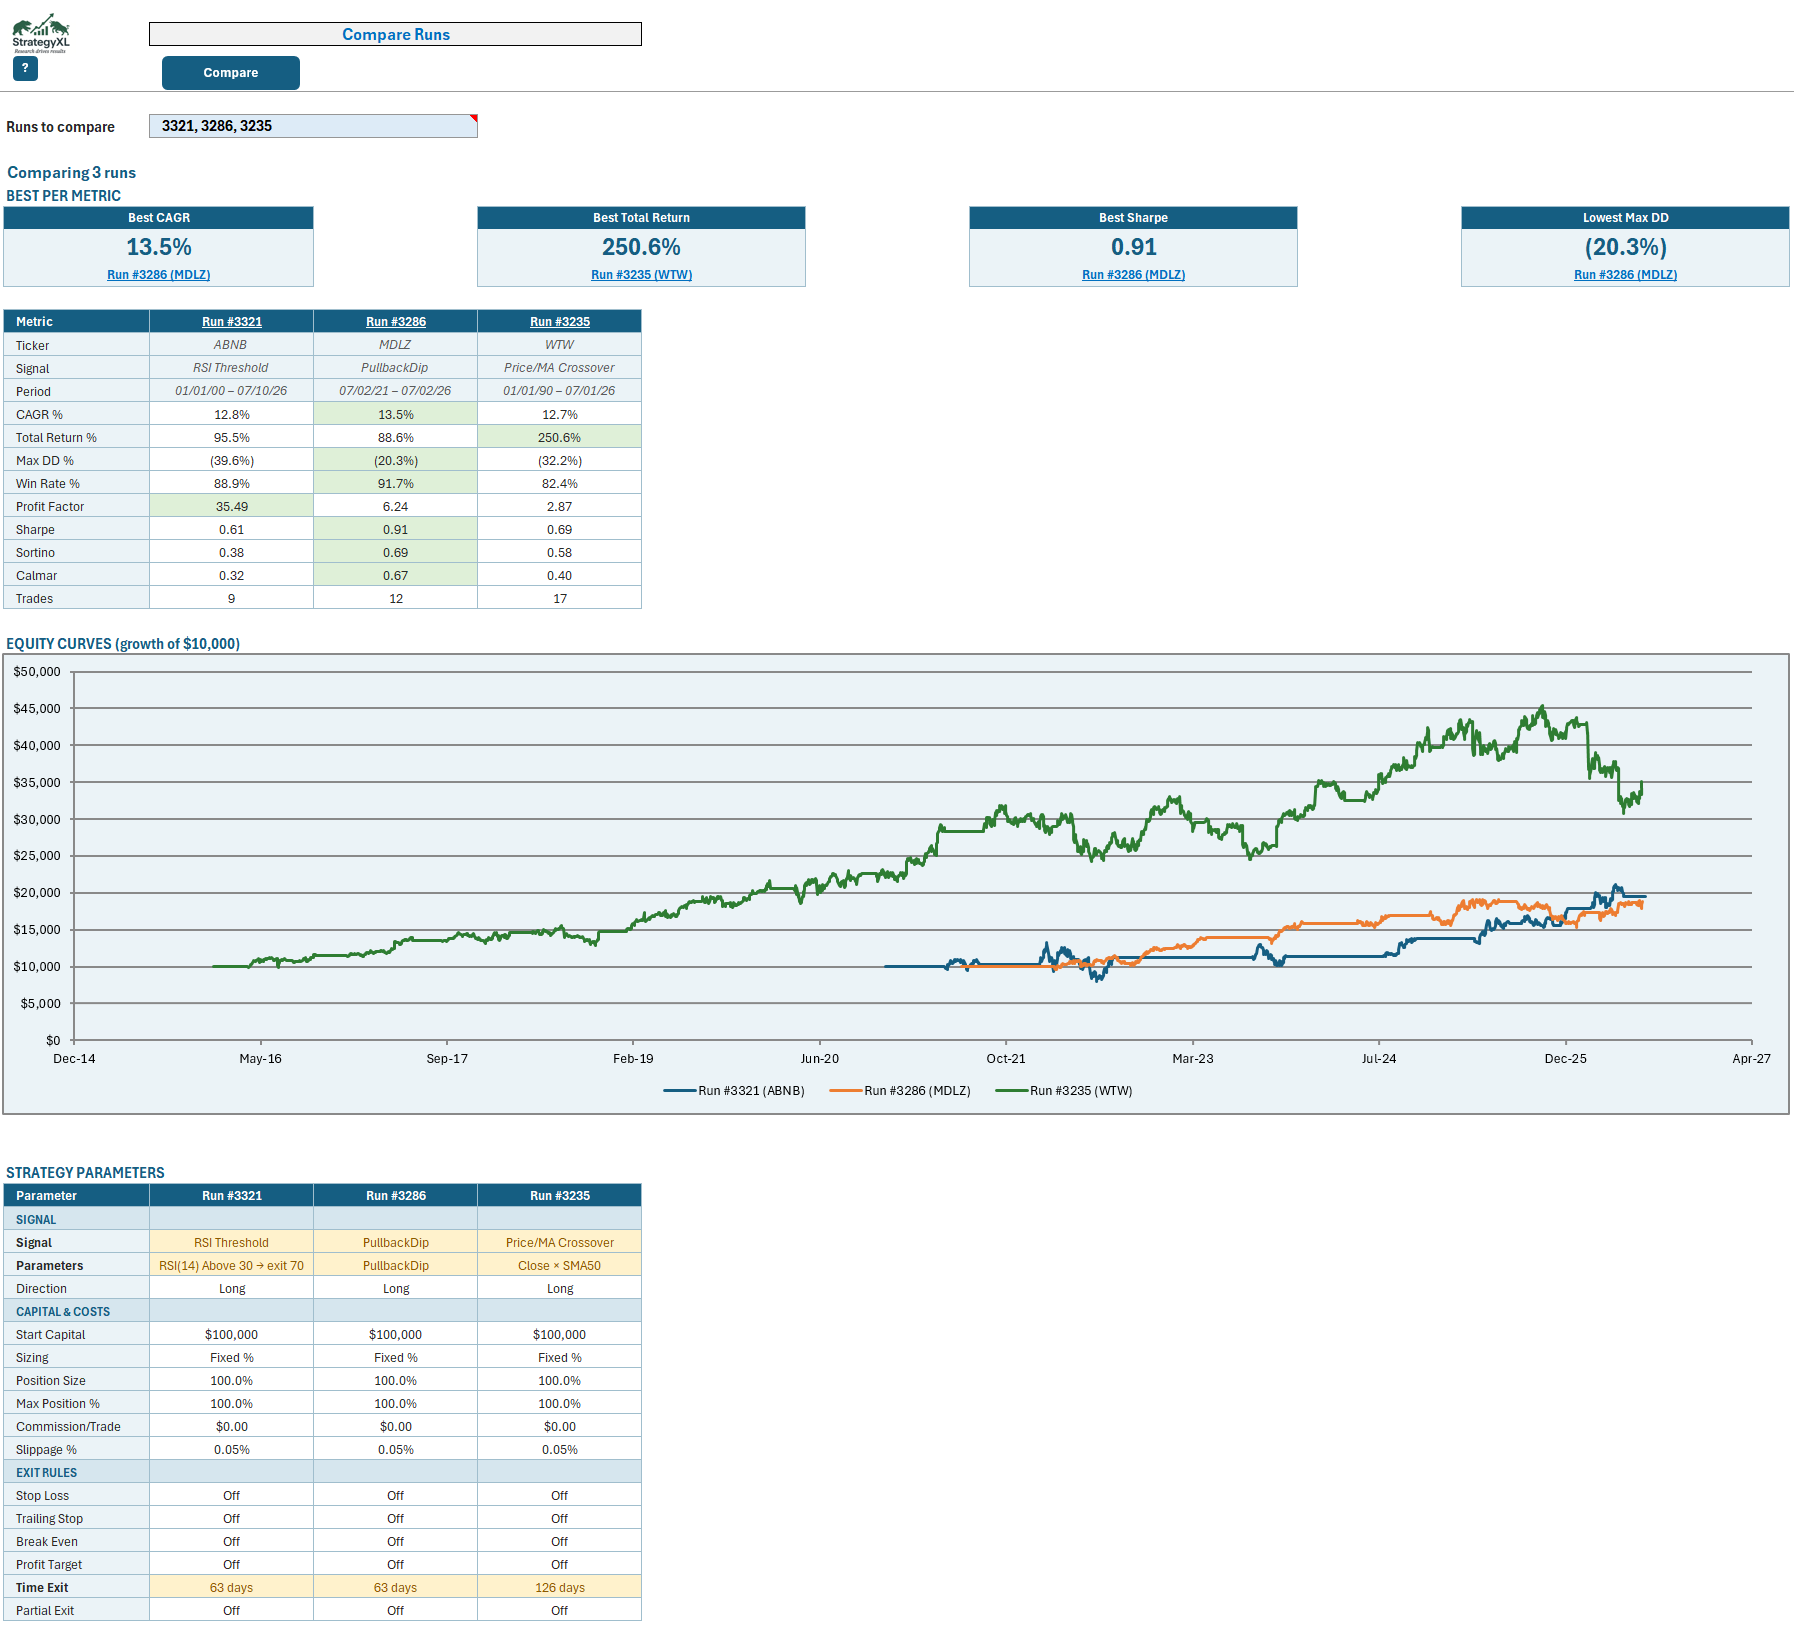
Line up as many as six runs side by side. Best-per-metric tiles crown the winners, a KPI matrix highlights the best cell in every row, their equity curves overlay (each grown from the same $10,000), and a parameter diff highlights exactly which settings differ — so you can see why one rule beat another, not just that it did.
Monthly or annual — research, backtesting, options income, and a full trade log, all in Excel on your own data. And your book stays yours: even if a subscription lapses, you can always open, back up, and restore your Trade Log.
StrategyXL is a research and testing tool — everything it shows is raw material for your own analysis, not a signal service and not financial advice.
Questions? — every message gets a real reply.