StrategyXL StrategyXL

Index Holdings

See what's inside SPY and QQQ

The full constituents of the S&P 500 and the Nasdaq 100 — weights, sectors, and market breadth — dropped into a formatted Excel sheet and refreshed every night, ready to read the moment you open it.
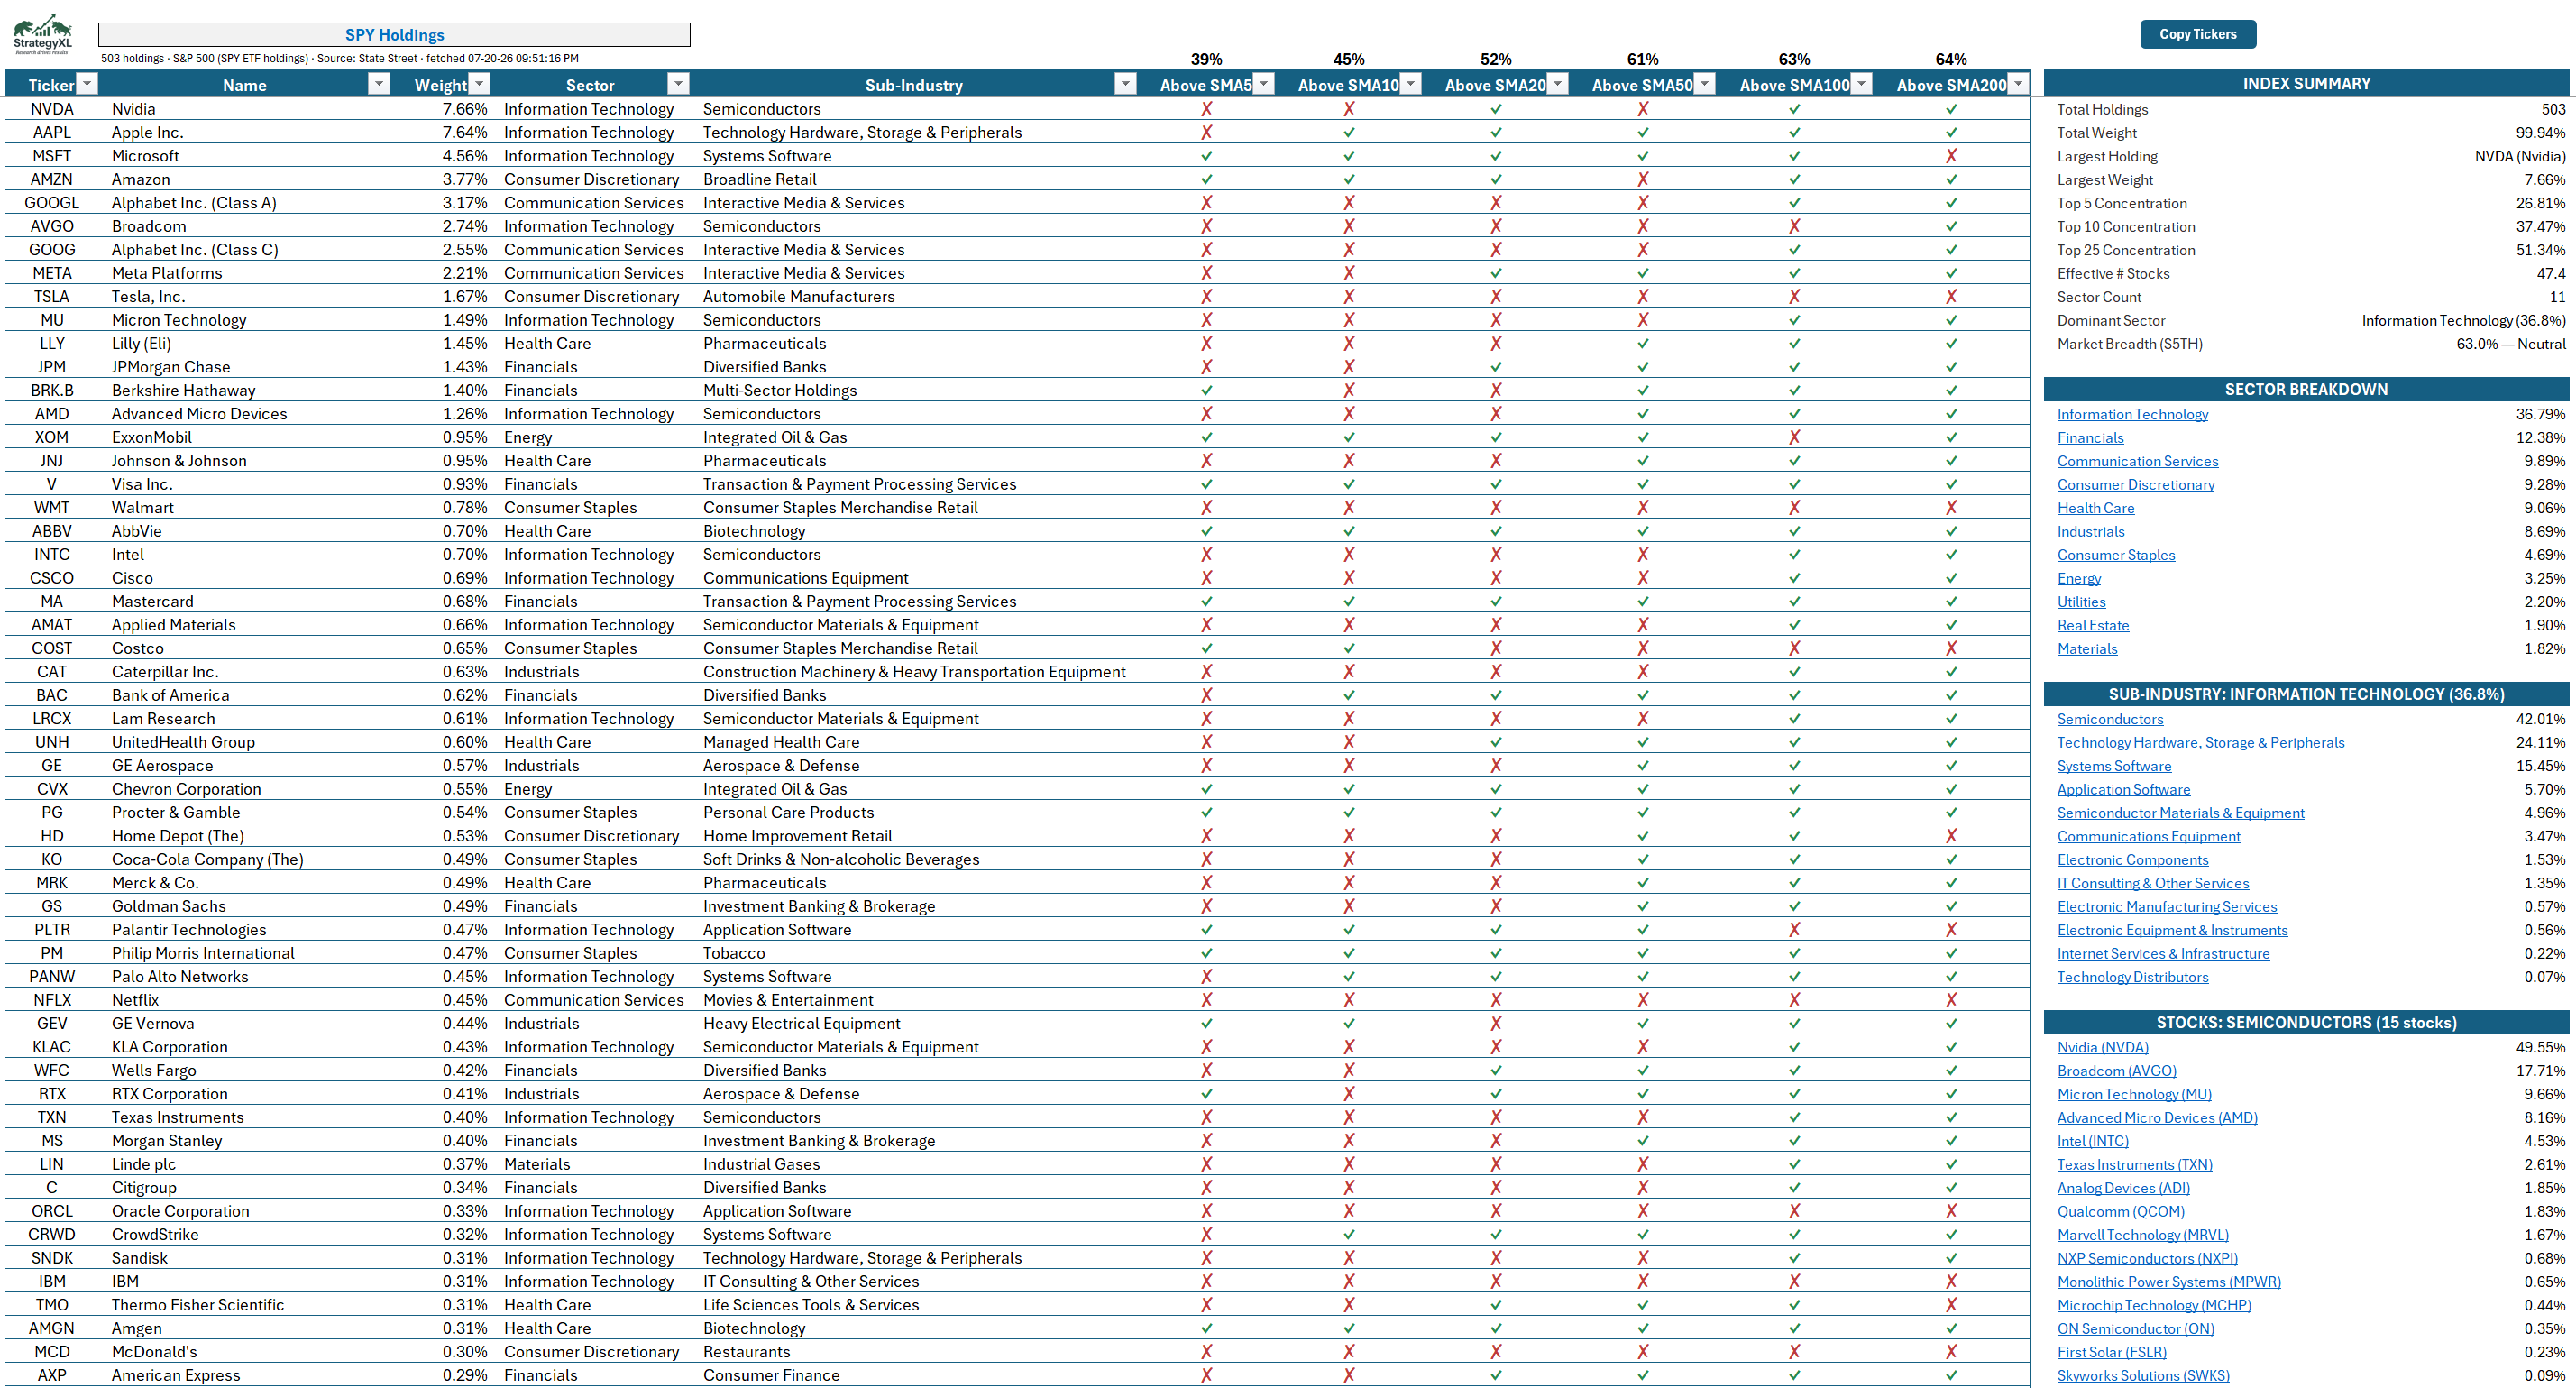
StrategyXL SPY (S&P 500) Holdings sheet in Excel: the full constituents table sorted by weight with sector and sub-industry, six above-SMA breadth glyph columns, an Index Summary panel with concentration and market-breadth stats, and a sector and sub-industry drill-down.
SPY (S&P 500) — all 503 constituents by weight, above-SMA breadth glyphs, and an Index Summary with concentration and market-breadth stats. · Click to enlarge.
StrategyXL SPY (S&P 500) Holdings sheet in Excel: the full constituents table sorted by weight with sector and sub-industry, six above-SMA breadth glyph columns, an Index Summary panel with concentration and market-breadth stats, and a sector and sub-industry drill-down.

The Nasdaq 100 (QQQ) gets the identical treatment:
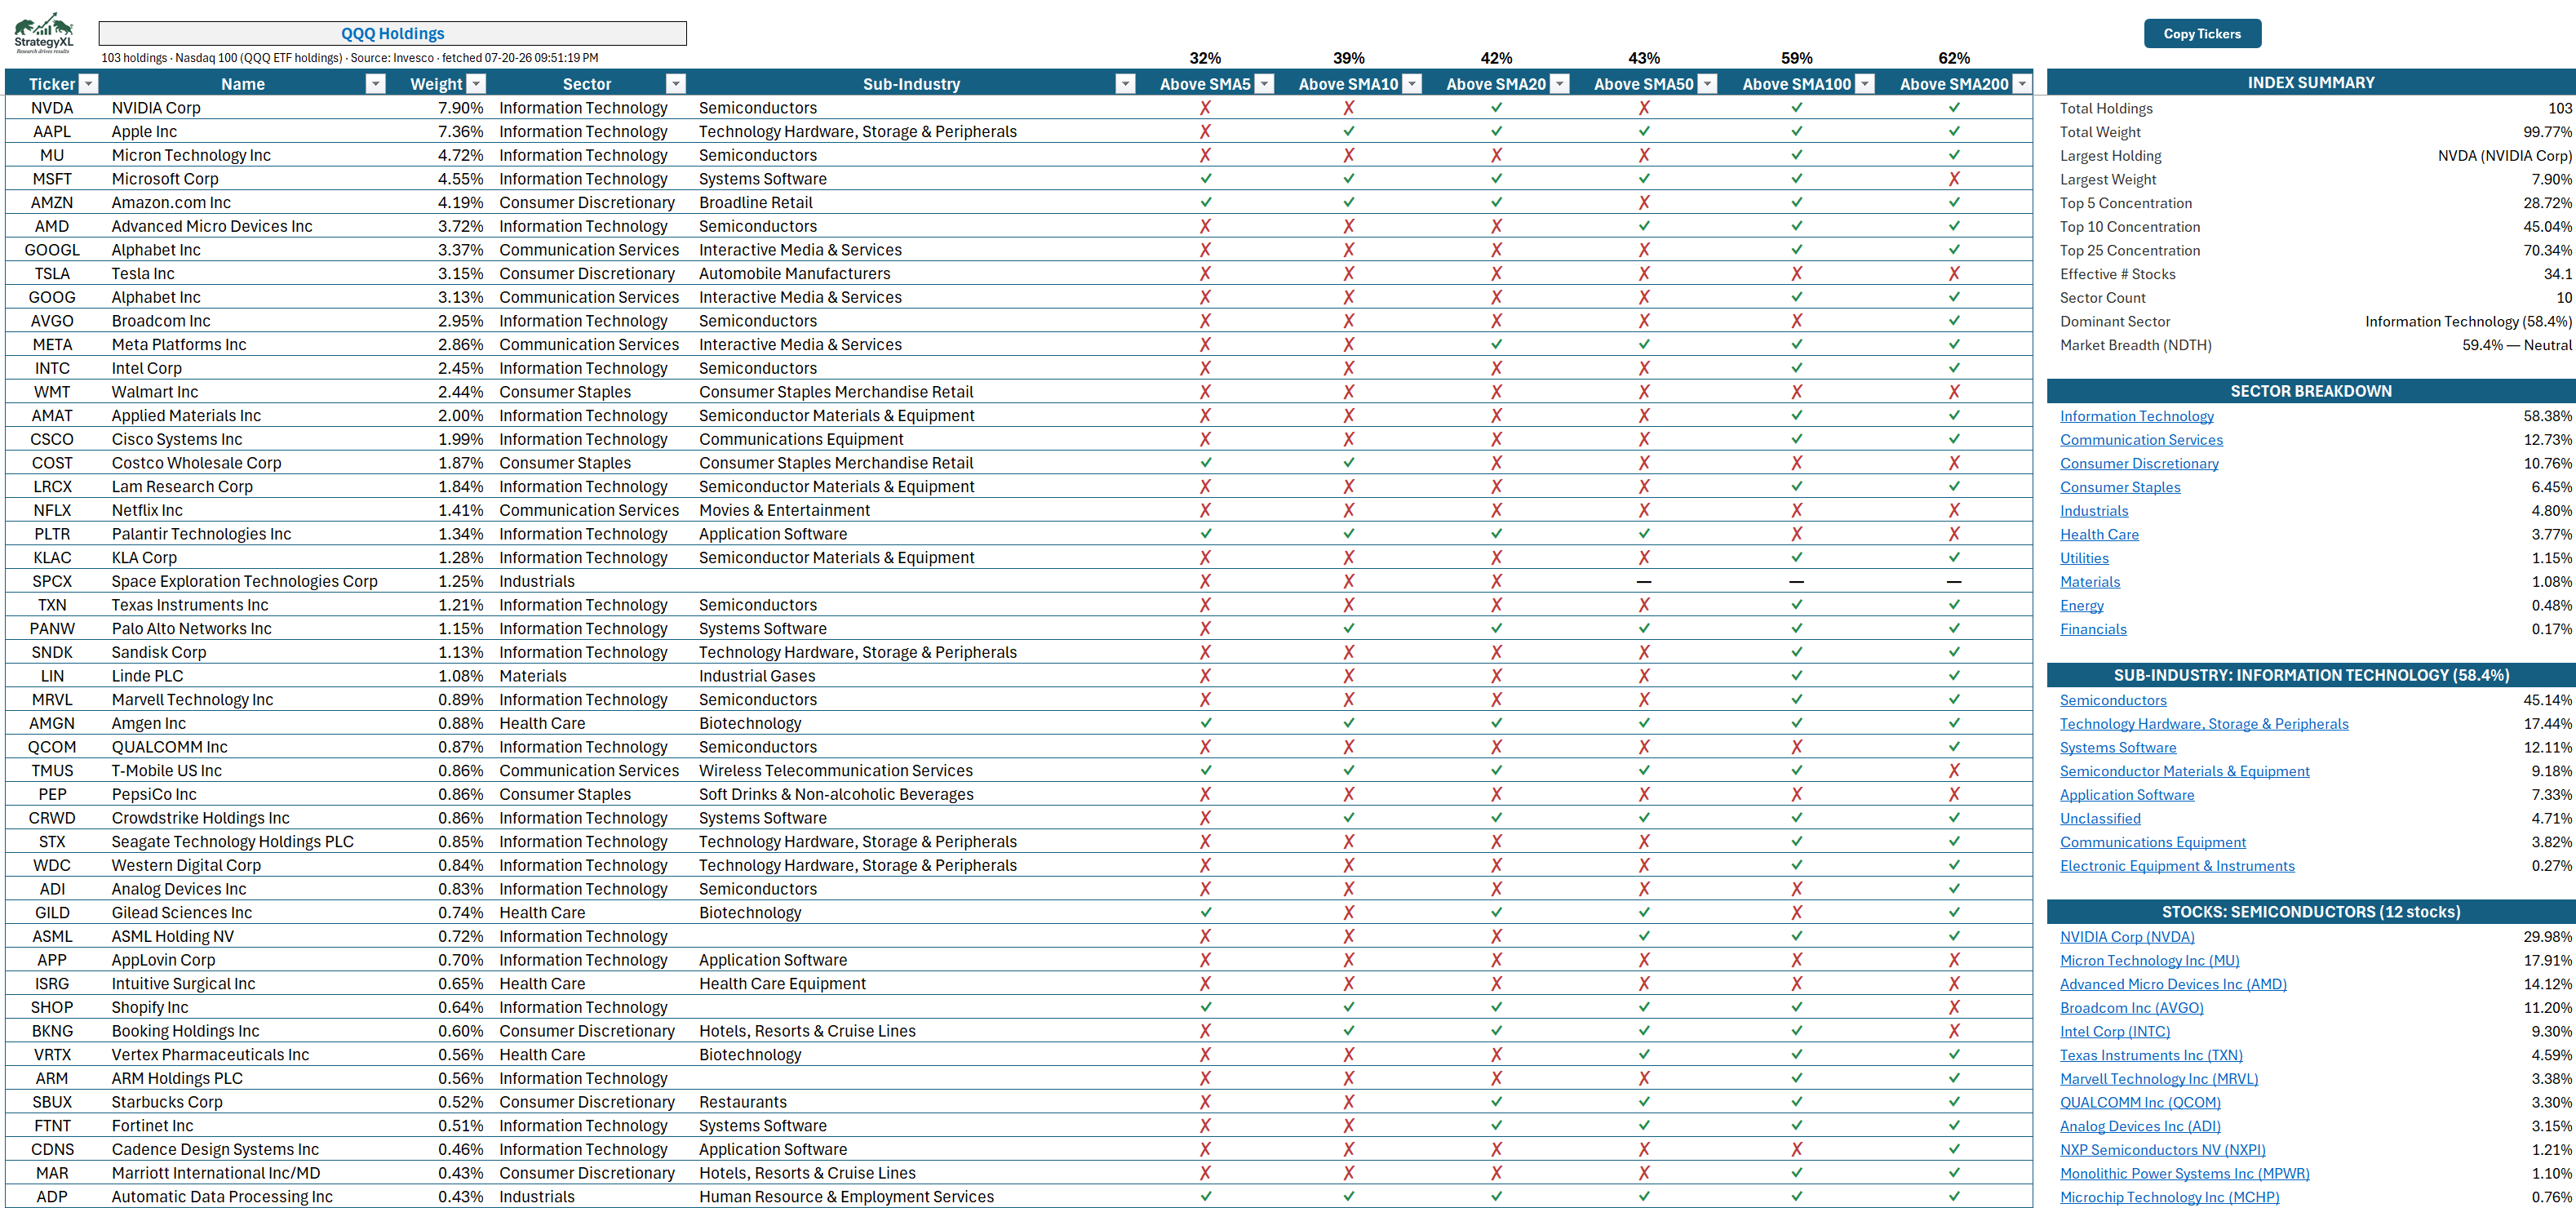
StrategyXL QQQ (Nasdaq 100) Holdings sheet in Excel: 103 constituents sorted by weight with sector and sub-industry, above-SMA breadth glyphs, an Index Summary panel, and the sector-to-sub-industry-to-stock drill-down.
QQQ (Nasdaq 100) — the same layout, 103 holdings, with the identical drill-down and breadth. · Click to enlarge.
StrategyXL QQQ (Nasdaq 100) Holdings sheet in Excel: 103 constituents sorted by weight with sector and sub-industry, above-SMA breadth glyphs, an Index Summary panel, and the sector-to-sub-industry-to-stock drill-down.

The whole index, drillable

·Every constituent, sorted by weight, with company, sector, and sub-industry.
·Above-SMA breadth glyphs per name across six windows (5 / 10 / 20 / 50 / 100 / 200 day), with the percentage above each.
·Sector → sub-industry → stock drill-down, so you can open any slice of the index.
·Concentration stats — top-5 / 10 / 25 weight, effective number of stocks, and the dominant sector.
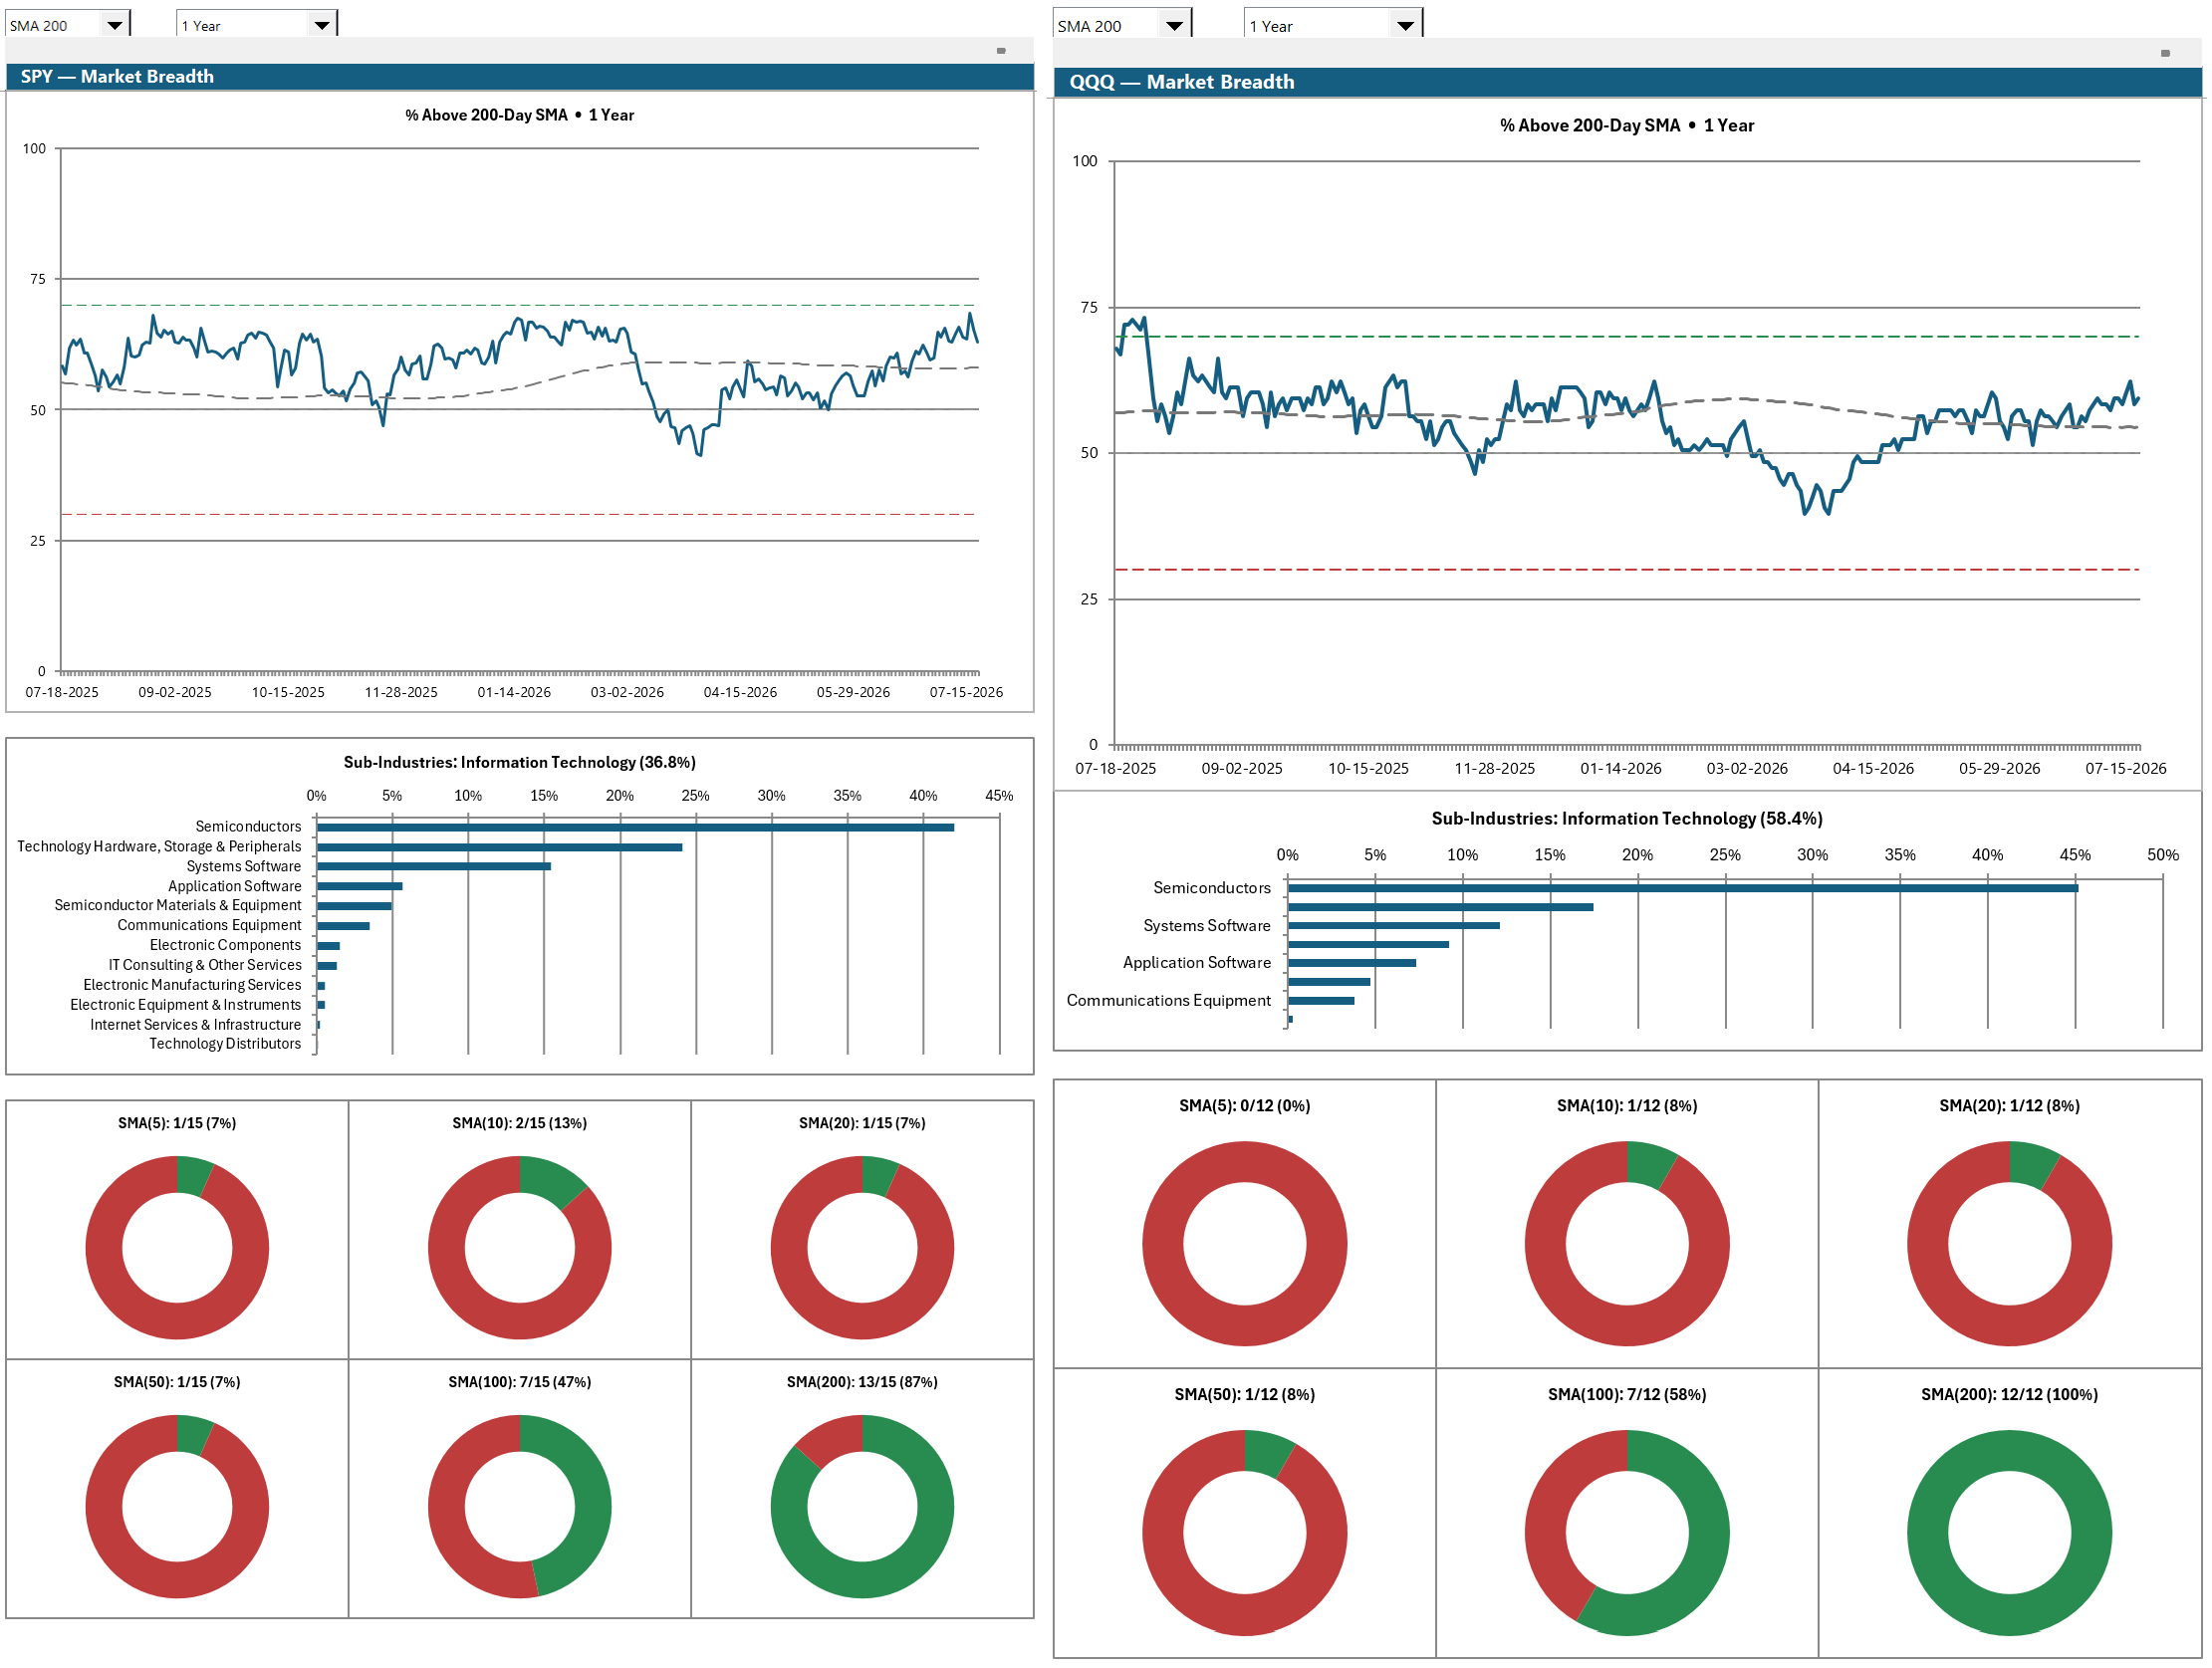
·A market-breadth chart — the share of the index above its moving average over time, with an oversold / overbought read.
·Copy Tickers — grab the whole list, or any drilled slice, for a batch backtest.
StrategyXL Index Holdings breadth charts in Excel: the percentage of SPY and QQQ constituents above their 200-day moving average over one year with oversold and overbought reference lines, sub-industry mix bar charts, and above-SMA donut grids across six moving-average windows for each index.
Market breadth over time (% above the 200-day), the sub-industry mix, and above-SMA donut grids — for each index. · Click to enlarge.
StrategyXL Index Holdings breadth charts in Excel: the percentage of SPY and QQQ constituents above their 200-day moving average over one year with oversold and overbought reference lines, sub-industry mix bar charts, and above-SMA donut grids across six moving-average windows for each index.

More to explore

Own the core for a one-time $99

Not $165 to $2,400 every year. An optional annual renewal keeps the research and live-data feeds current — everything else is yours to keep.

StrategyXL is a research and testing tool — everything it shows is raw material for your own analysis, not a signal service and not financial advice.

Questions? — every message gets a real reply.

Get in touch

Send a note and I'll get back to you — every message gets read.

Please provide your full name.
Please provide your email address.
Please provide a valid email address.
Please enter your message.