Research feed
Every market night, StrategyXL studies how technical events have really played out across the S&P 500, the Nasdaq 100, and ~80 major ETFs — then scores the results into a short, vetted list of ideas. You open Excel to a fresh feed, not a blank sheet.
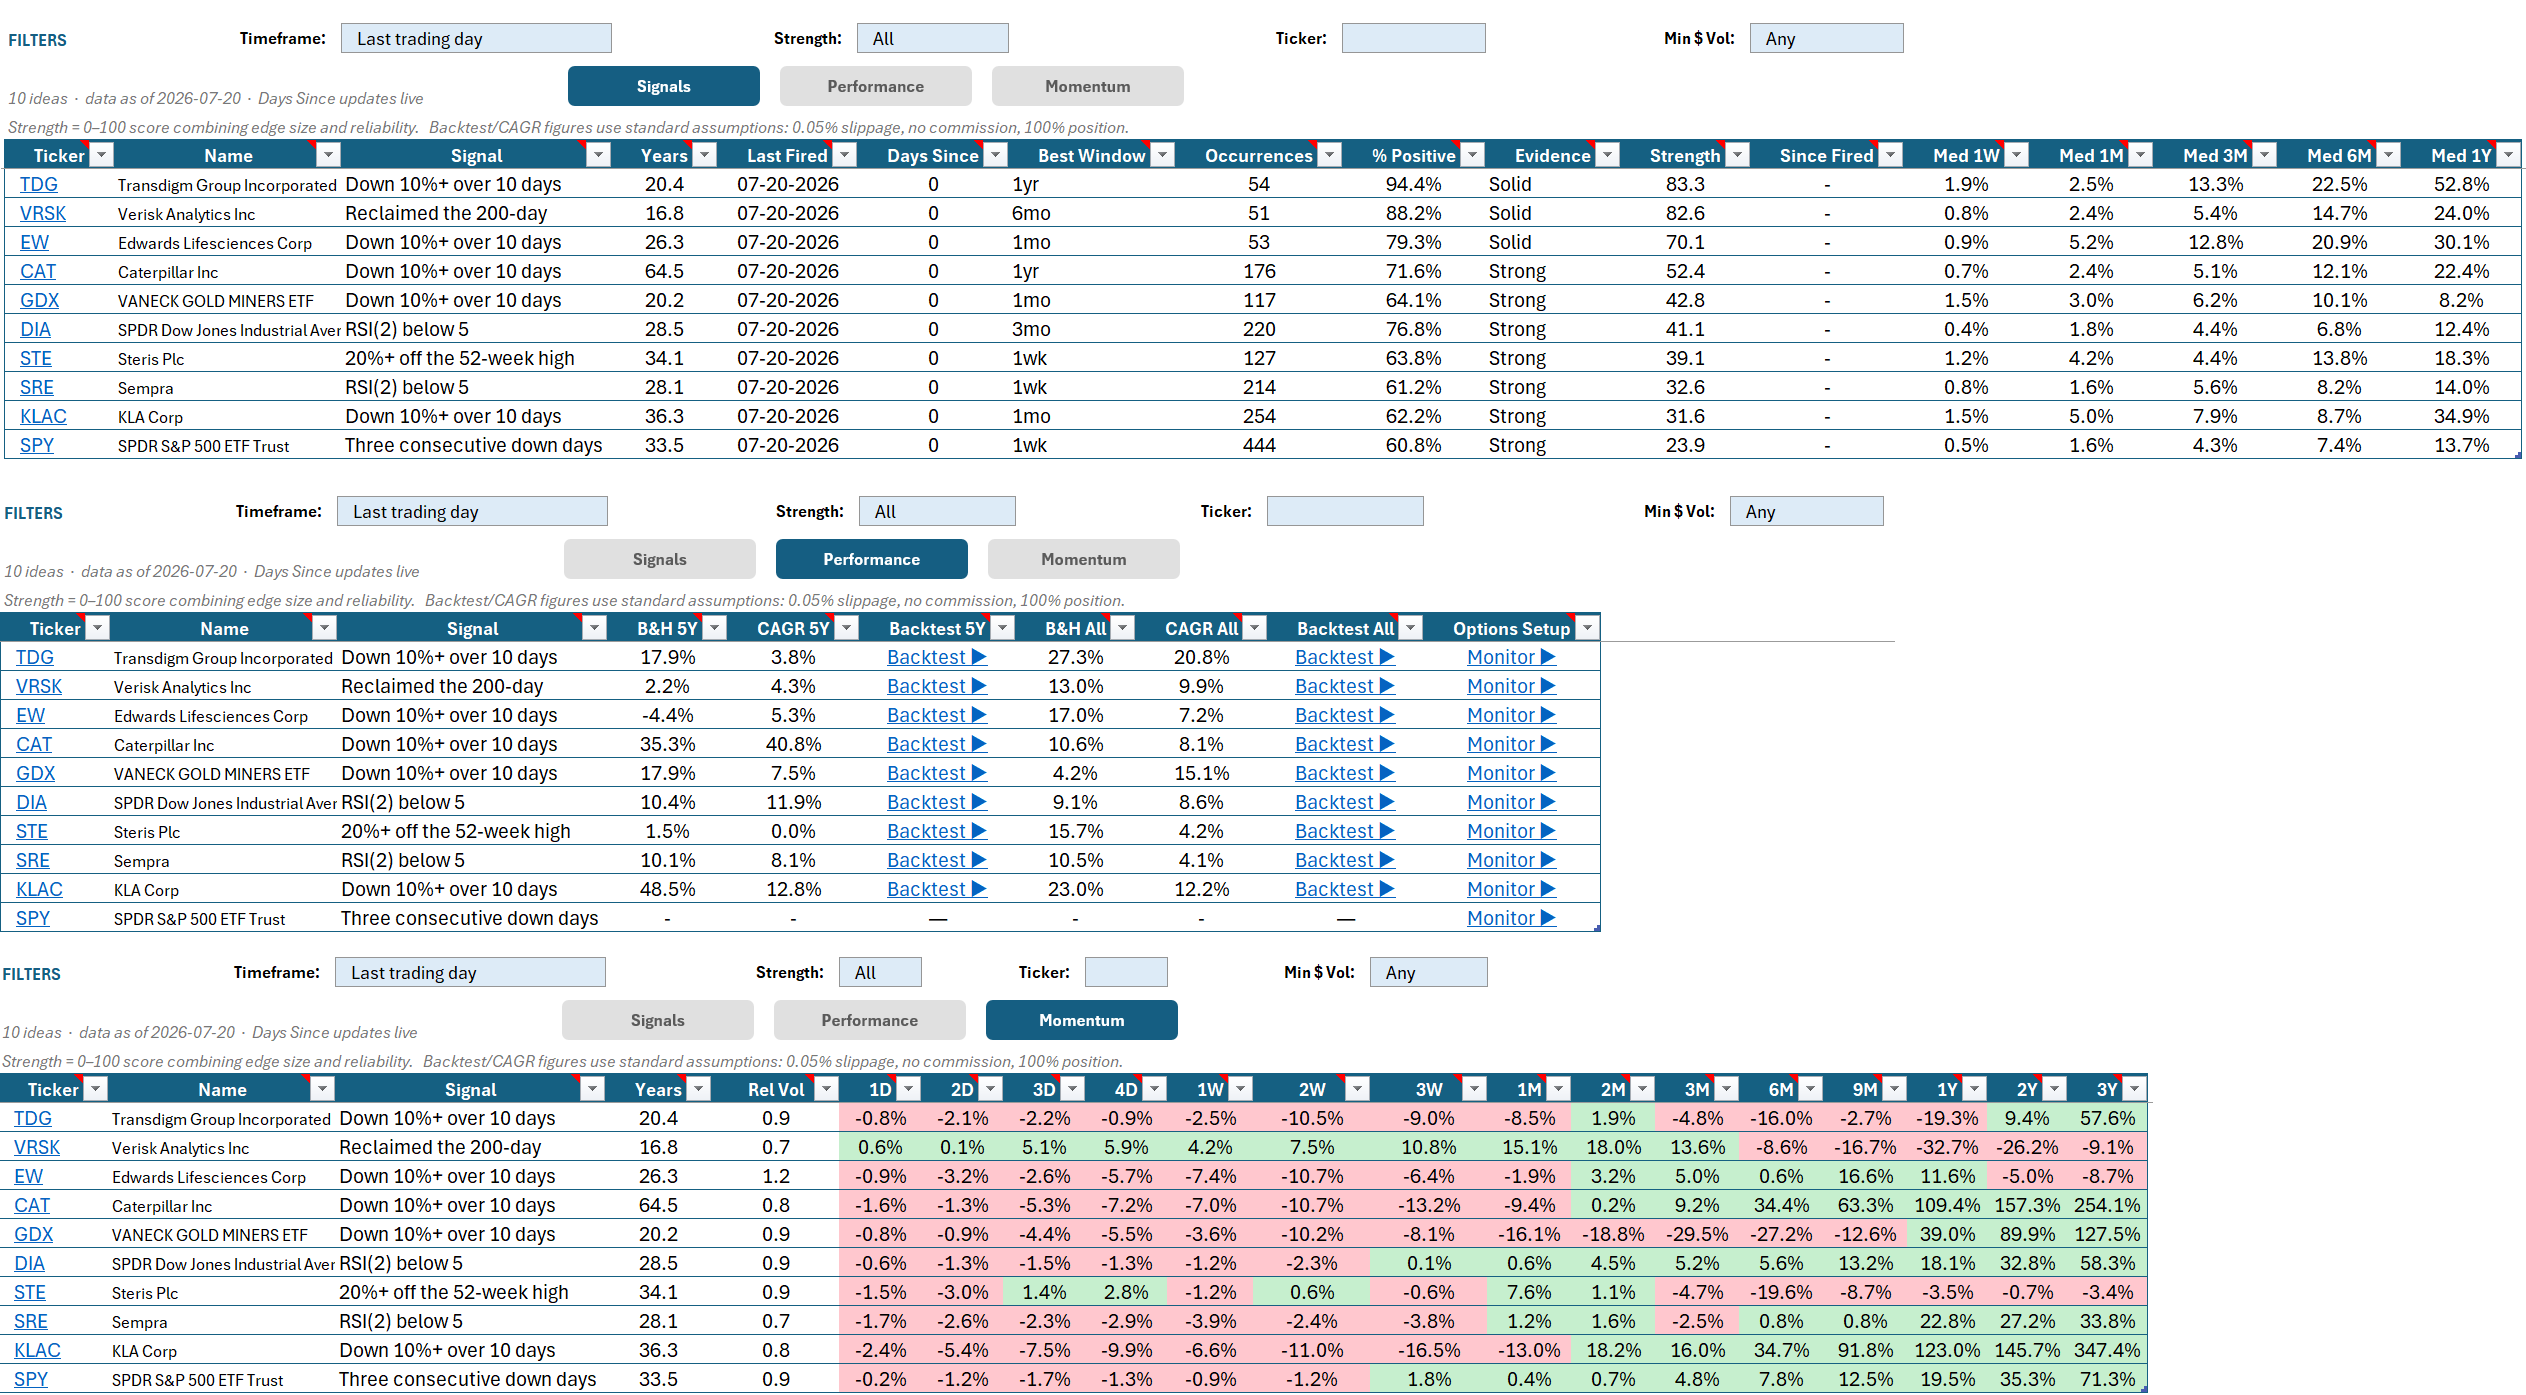
For each of ~600 instruments, the pipeline detects technical events — golden and death crosses, 200-day and 50-day reclaims and breaks, channel breakouts, RSI and MACD crossings, Bollinger breaks, and mean-reversion drops — the moment they fire. Then it measures the real forward total return after each one across five horizons (1 week to 1 year), compared against that instrument's own baseline and against SPY and QQQ.
Not every pattern that looks good is real. Overlapping windows are corrected for, an edge has to clear a significance bar, and results carry a confidence tier — so the vetted feed is the signal, not the noise.
The published research numbers are produced by the same engine that runs your backtests. So when you click through an idea into a full backtest, the historical CAGR reproduces exactly — parity by construction, not a marketing figure you have to trust.
The short list — vetted, gate-passing events scored to the top, each with its forward stats and a one-click drill into the backtest that produced them.
The full landscape — every recent crossing across the universe, for when you want to browse rather than be handed the shortlist.
Month-by-month seasonality per instrument — which calendar months have historically been strong or weak, measured on a total-return basis.
A momentum-leaders screen ranking the universe by multi-horizon total-return momentum, with a liquidity and relative-volume context layer.
Your own names, with a full return grid (1W to 1Y, YTD) — and when Live Data is connected, the whole grid recalculates off a live last price.
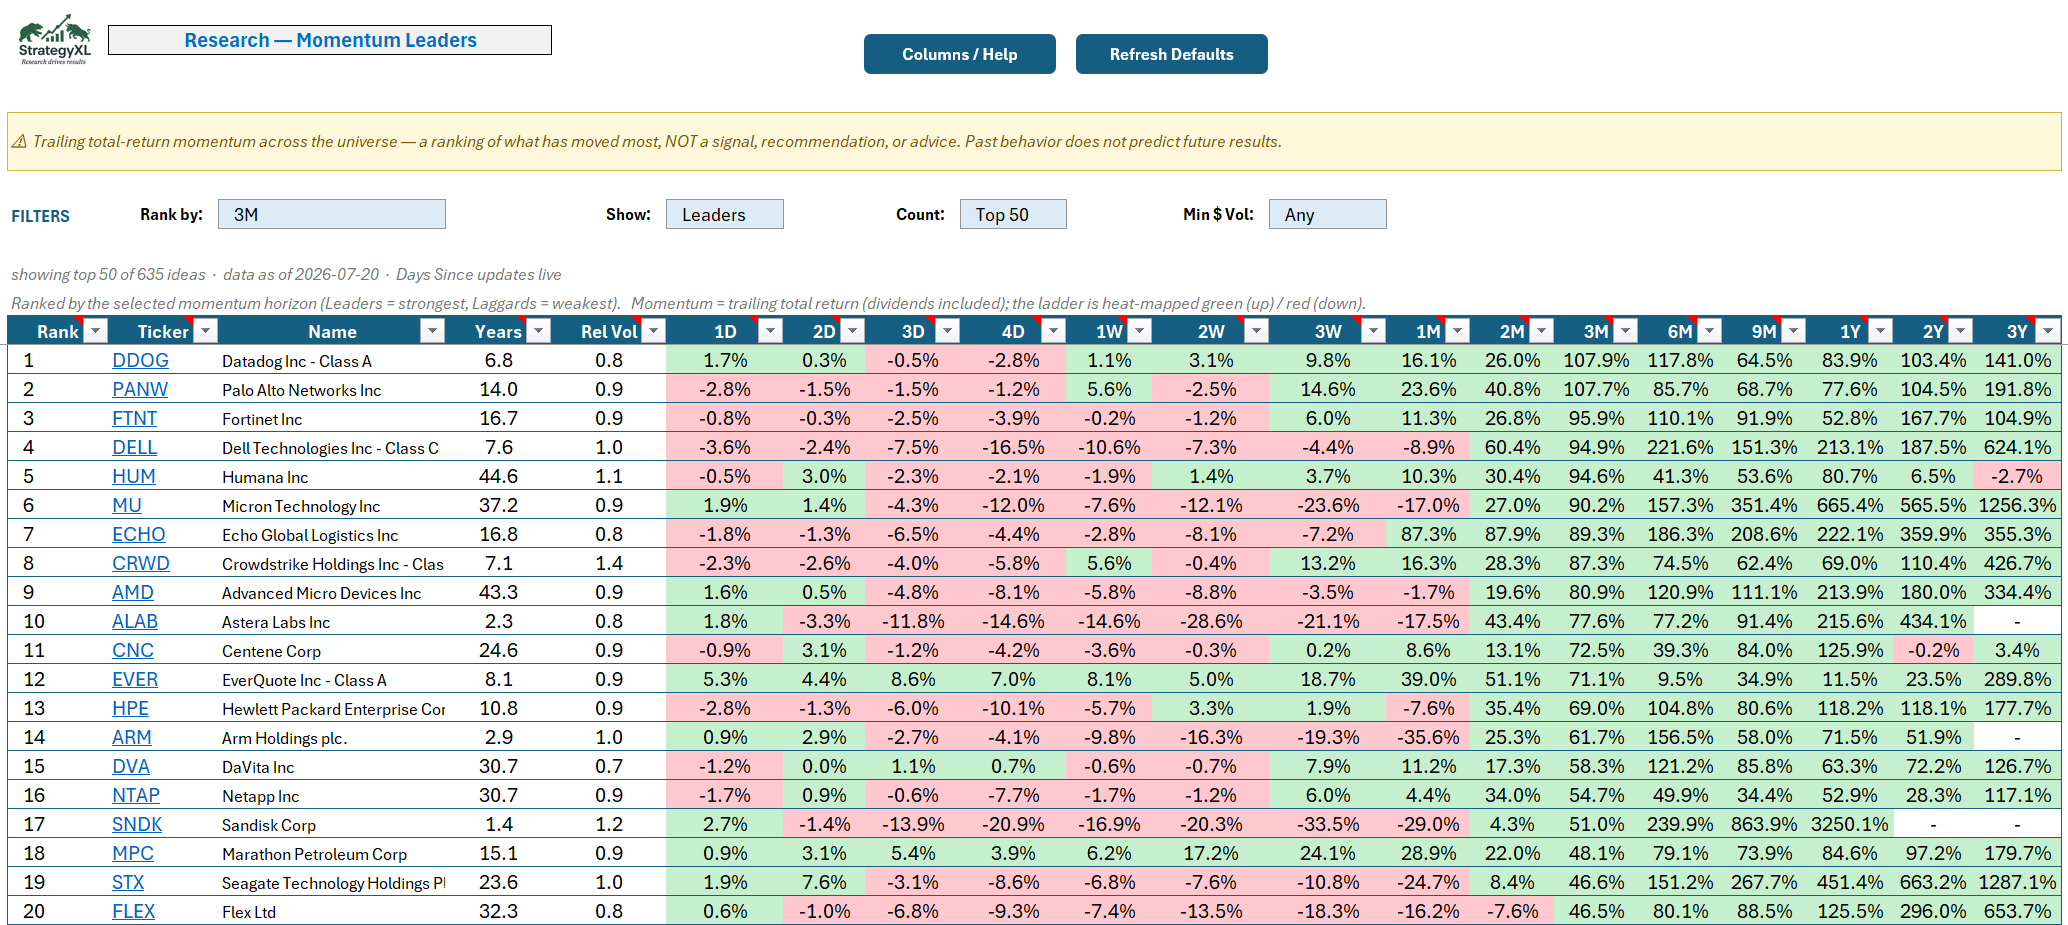
The research feed measures history — it doesn't predict the future. Everything is raw material for your own analysis, never a recommendation. It's also included with every StrategyXL subscription — see pricing.
Monthly or annual — research, backtesting, options income, and a full trade log, all in Excel on your own data. And your book stays yours: even if a subscription lapses, you can always open, back up, and restore your Trade Log.
StrategyXL is a research and testing tool — everything it shows is raw material for your own analysis, not a signal service and not financial advice.
Questions? — every message gets a real reply.