Price History & Advanced Charting
Pull clean daily price history for any ticker — then, instead of leaving you staring at a grid of numbers the way most tools do, StrategyXL keeps going: a full statistical summary, native charts, seasonality, and a full-screen interactive charting window with a fund-style returns table. Same raw data everyone has — far more done with it.
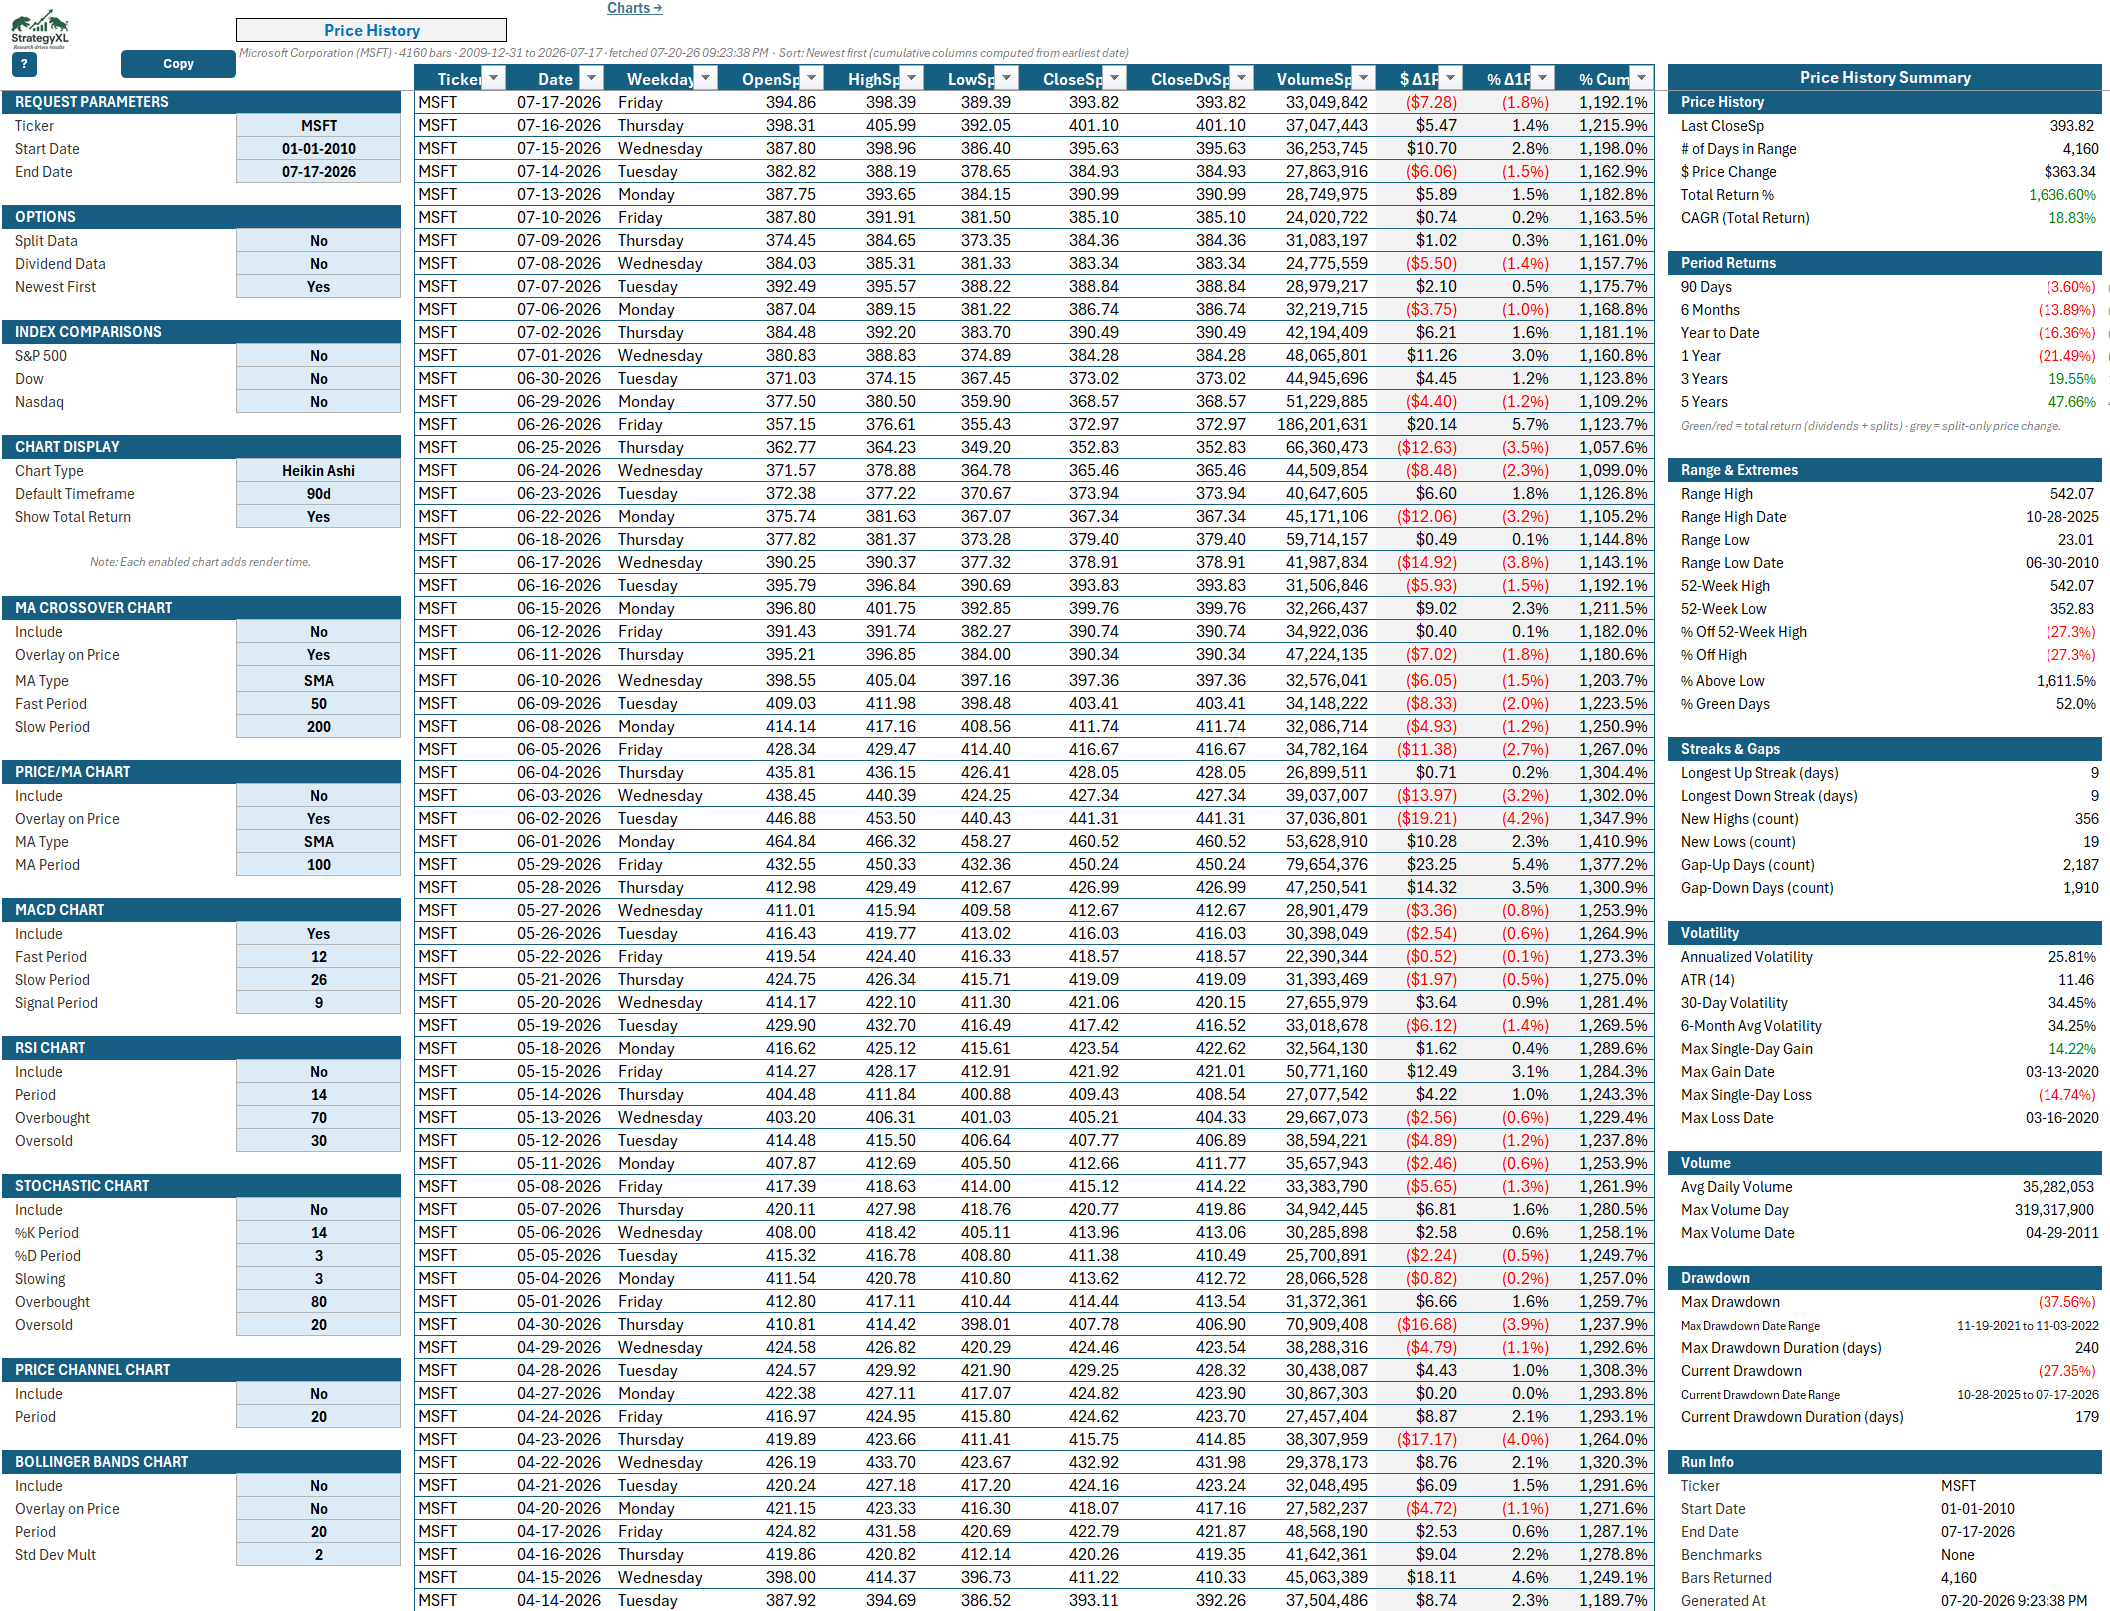
Fetch daily OHLCV for any ticker with your own data key. Most tools stop there — a grid of numbers. StrategyXL computes a full statistical summary right alongside it: total return and CAGR, period returns from 90 days to five years, range and extremes, up- and down-streaks, volatility, average volume, and drawdown.
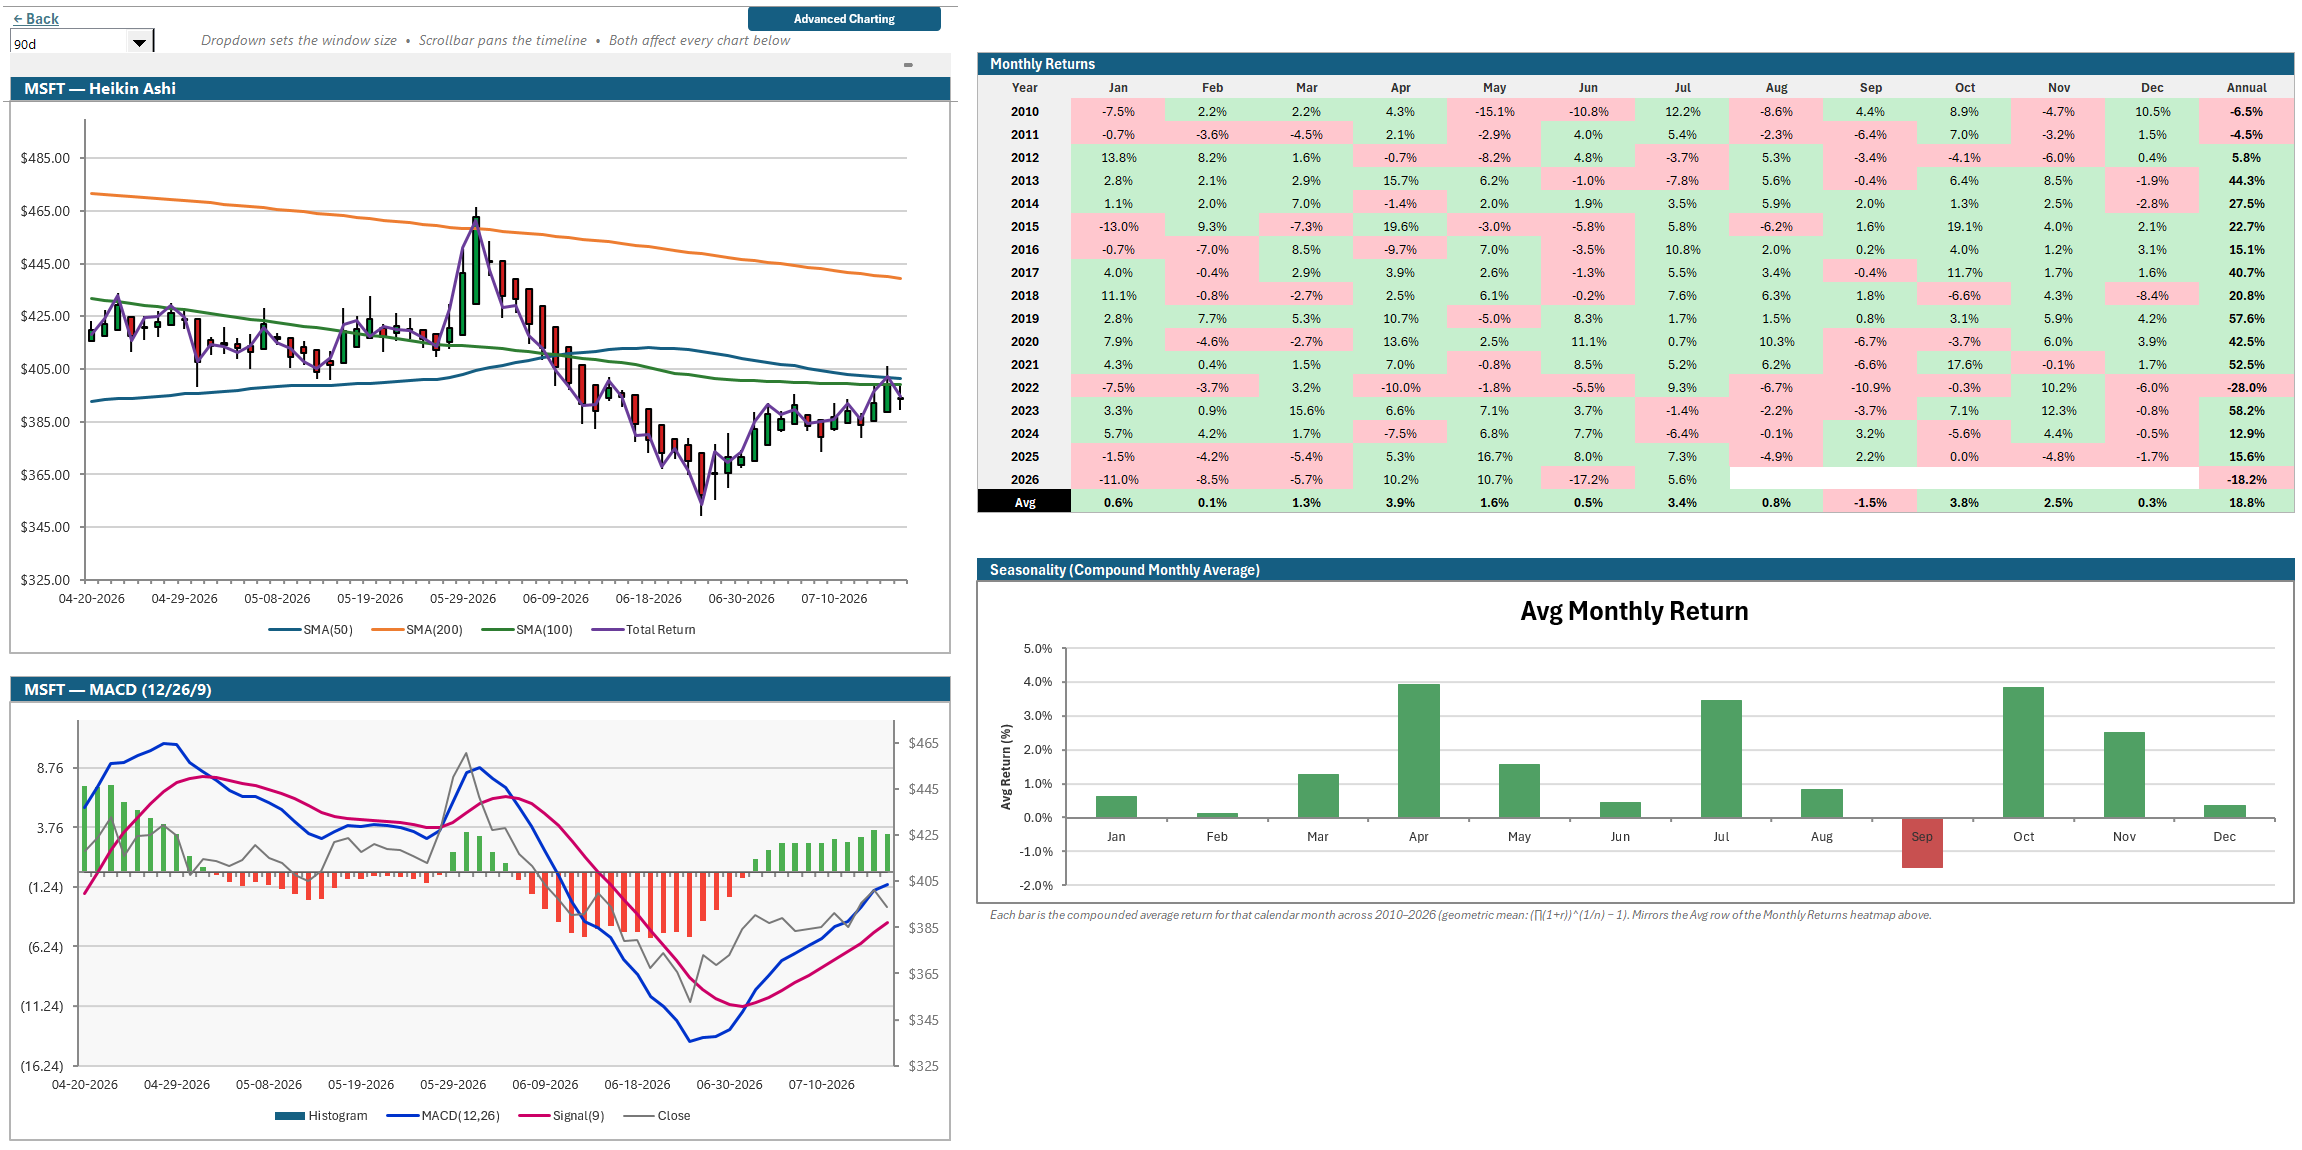
Then flip on whatever you want to see — moving-average crossovers, Price/MA, MACD, RSI, Stochastic, price channels, Bollinger Bands, and index benchmarks — each a one-click toggle. StrategyXL renders them natively in the sheet, with a monthly-returns heatmap and a seasonality view of the compounded average return by calendar month.
One click further
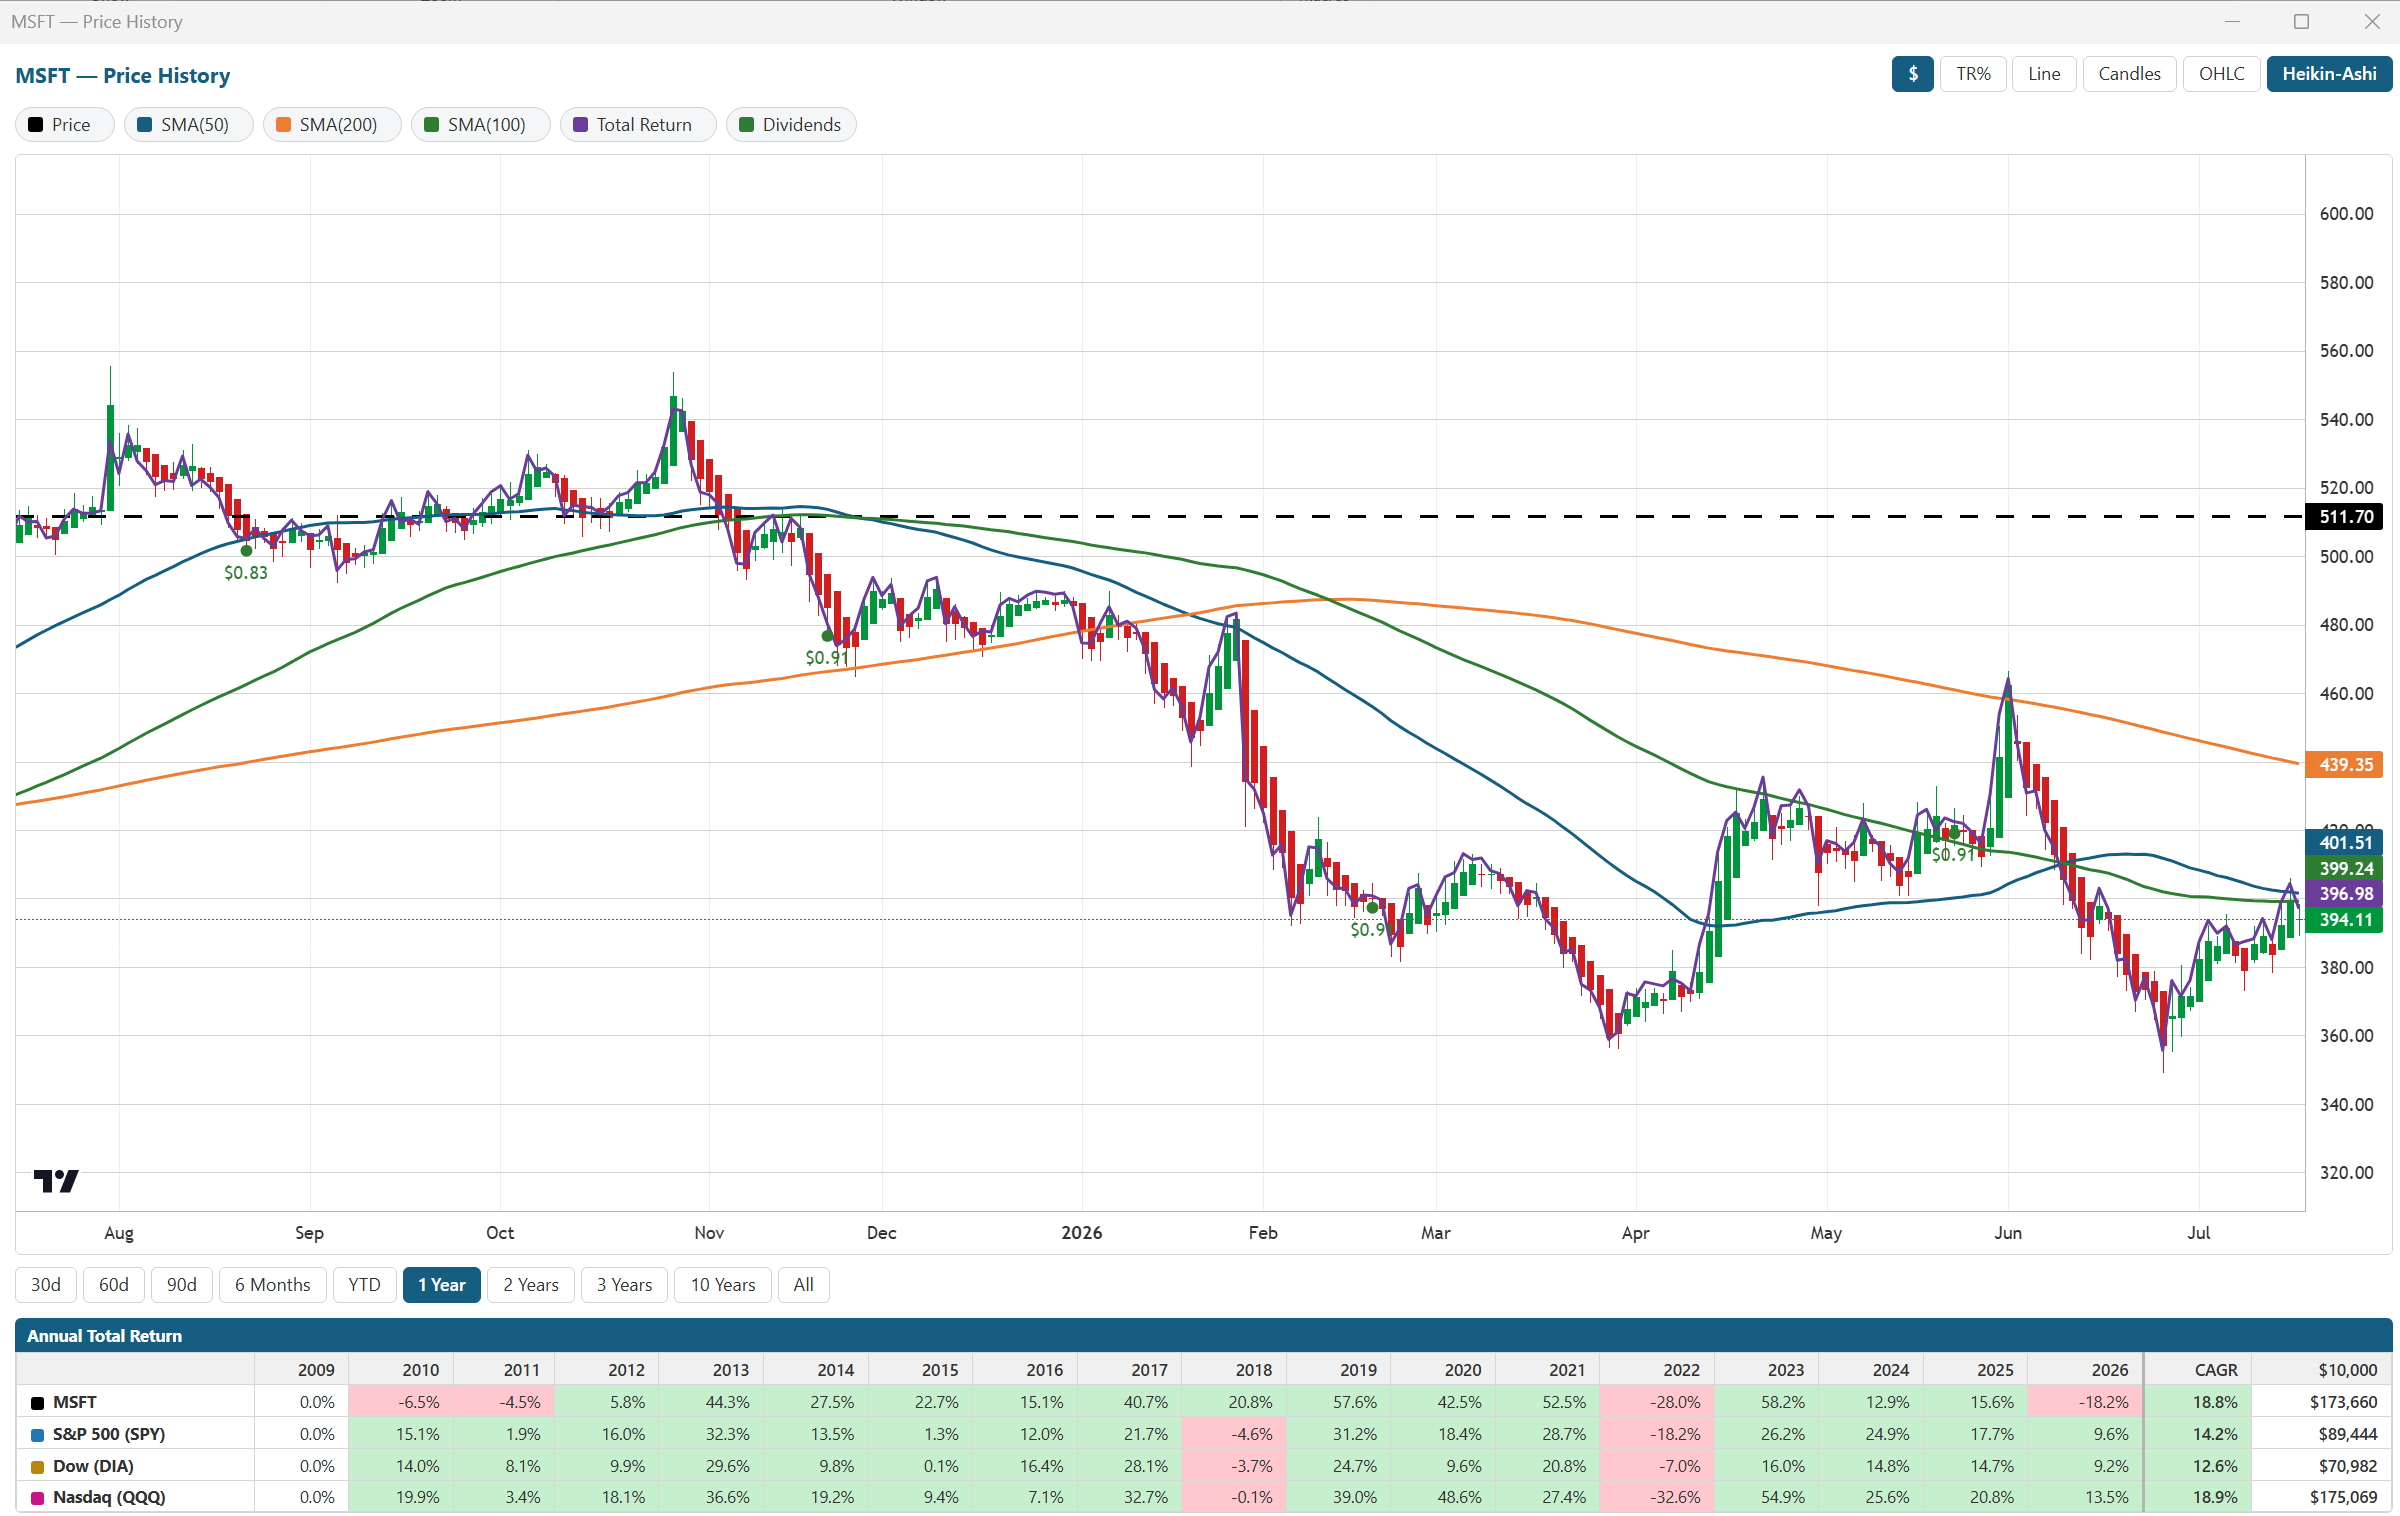
Open a maximized, resizable charting window powered by TradingView's Lightweight Charts (vendored and fully offline — nothing phones home). It's a real financial chart:
One click flips the whole window to total-return % — every series rebased to 0% at the left edge and compared head-to-head against the S&P 500, Dow, and Nasdaq:
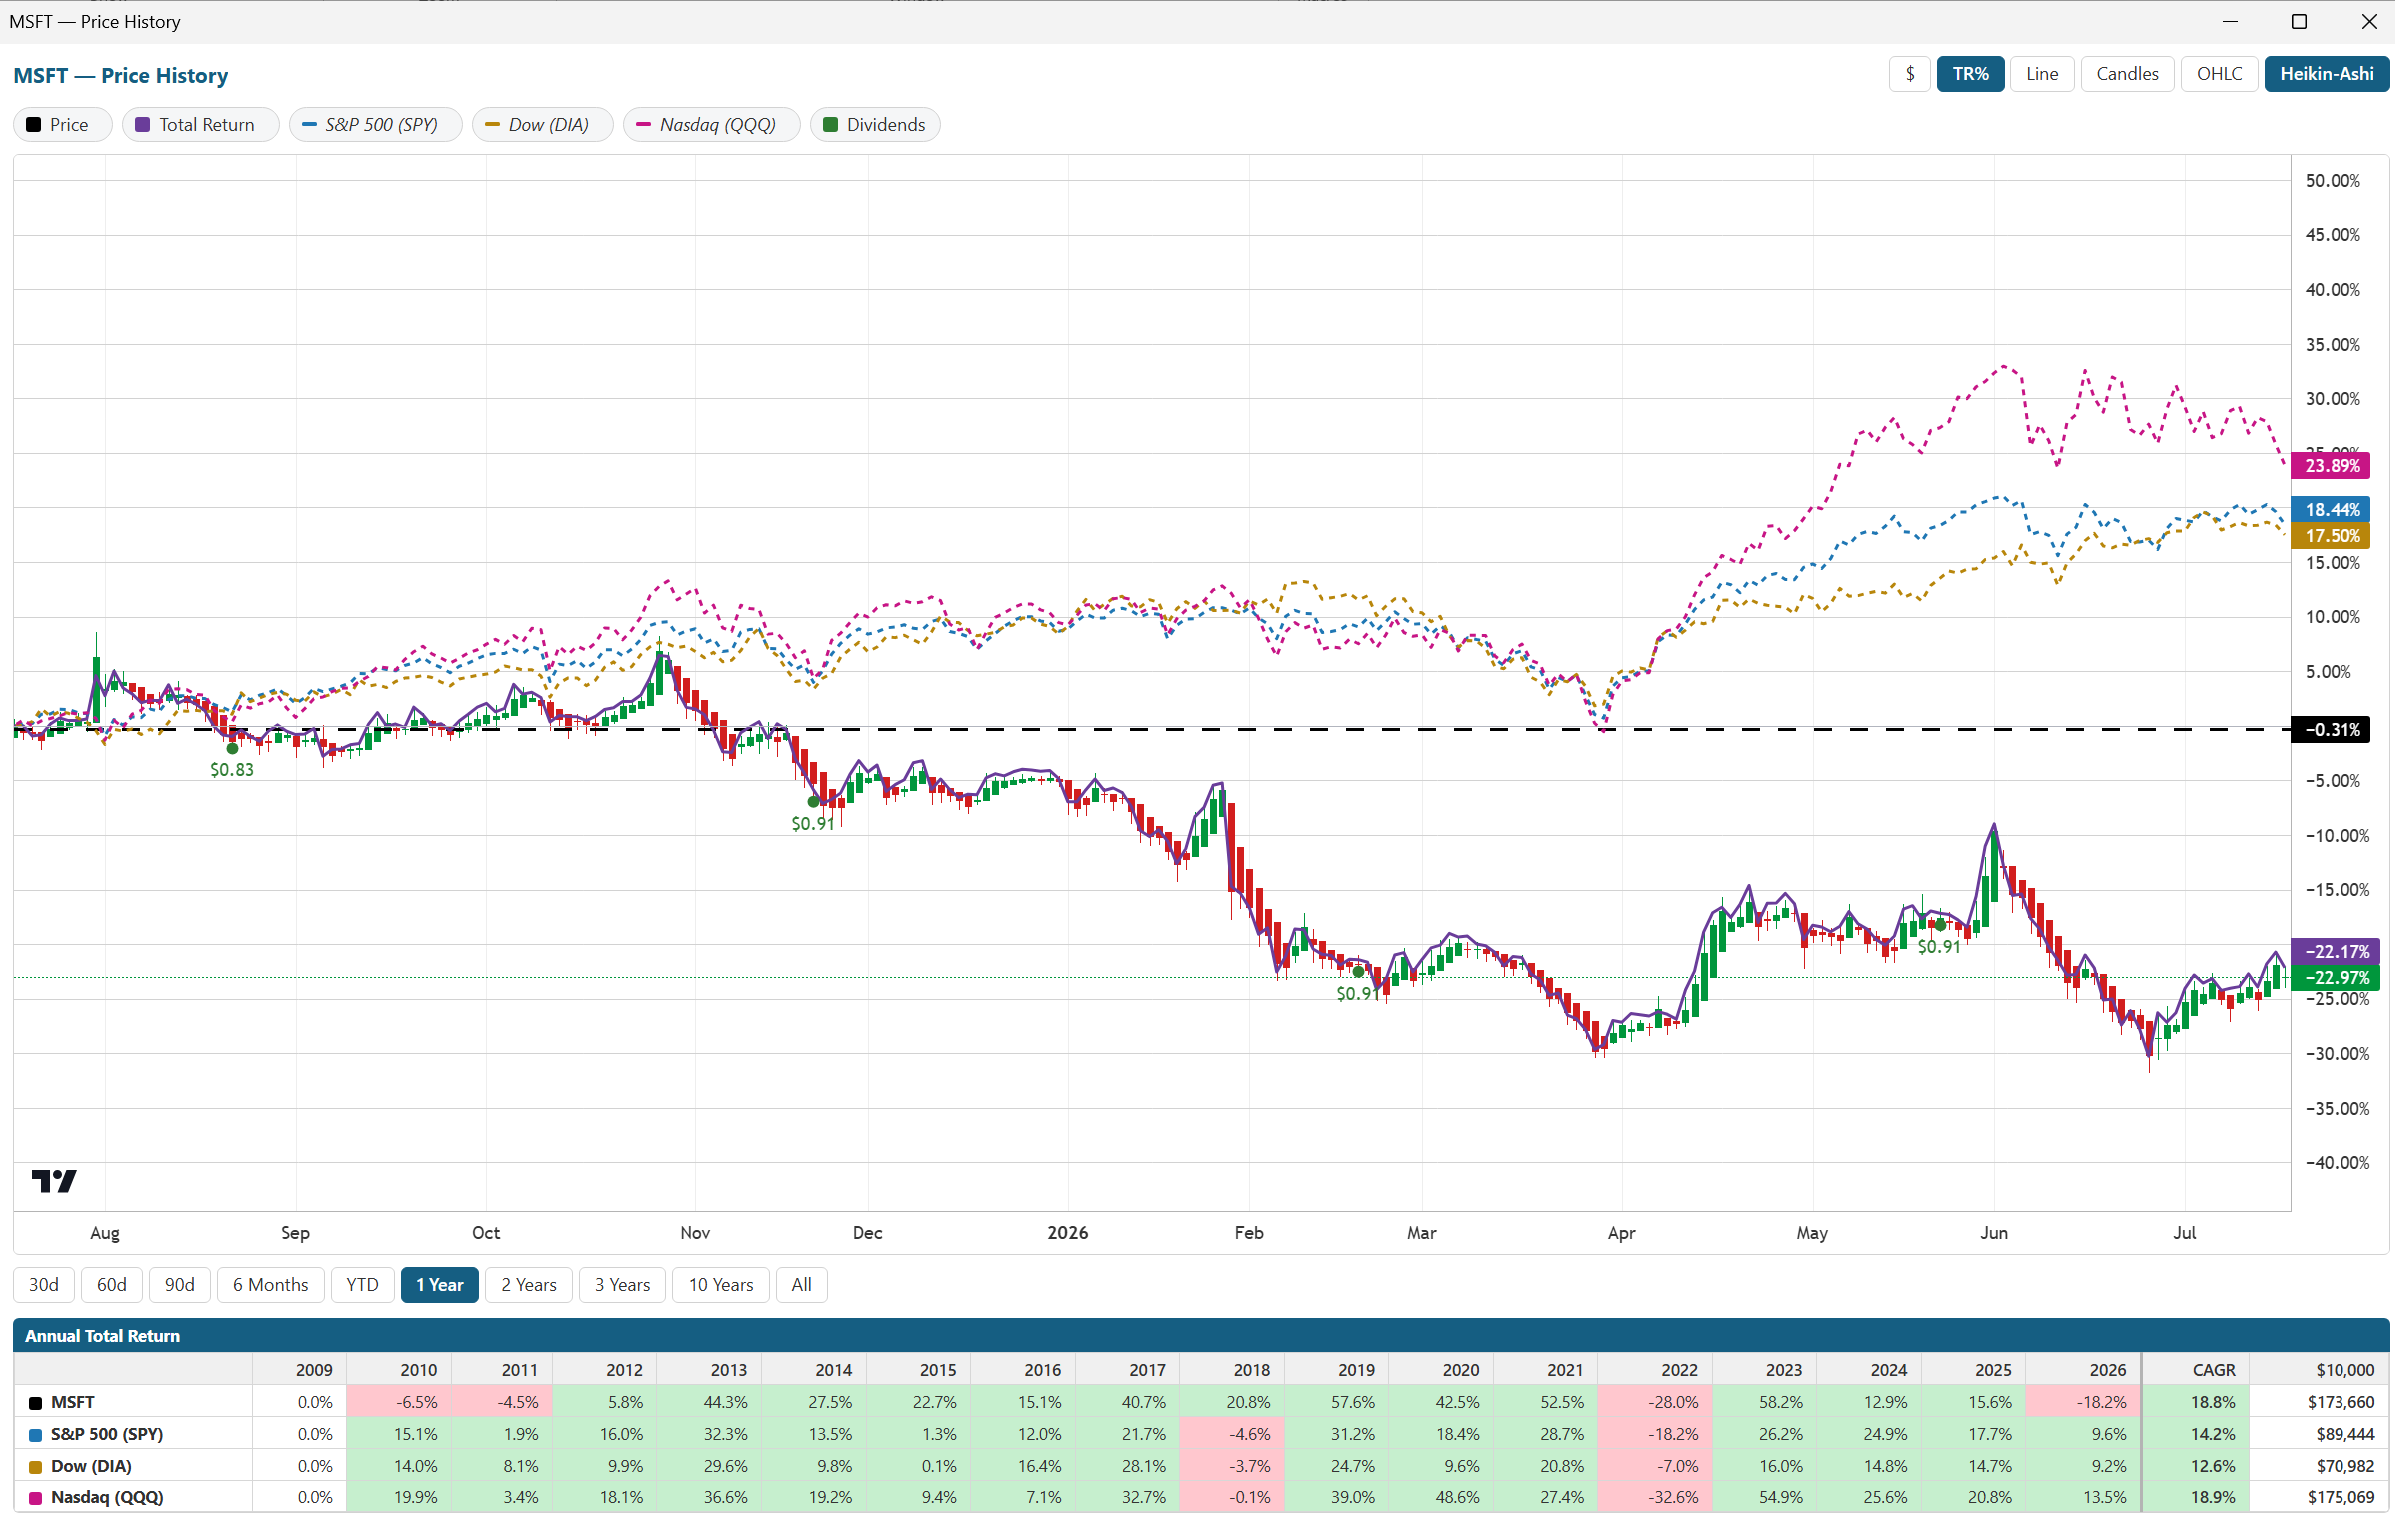
Under every chart sits the table you'd normally only see on a fund fact sheet: each instrument's annual total return by year, plus its CAGR and the growth of $10,000 since inception — the stock and every benchmark starting on the same date, apples-to-apples, in the familiar green/red heatmap shades.
Monthly or annual — research, backtesting, options income, and a full trade log, all in Excel on your own data. And your book stays yours: even if a subscription lapses, you can always open, back up, and restore your Trade Log.
StrategyXL is a research and testing tool — everything it shows is raw material for your own analysis, not a signal service and not financial advice.
Questions? — every message gets a real reply.